DxChartSeriesPointImage Class
Contains image settings for points of the chart’s Line series.
Namespace: DevExpress.Blazor
Assembly: DevExpress.Blazor.v22.1.dll
NuGet Package: DevExpress.Blazor
Declaration
public class DxChartSeriesPointImage :
    DxSettingsComponent<ChartSeriesPointImageModel>
Remarks
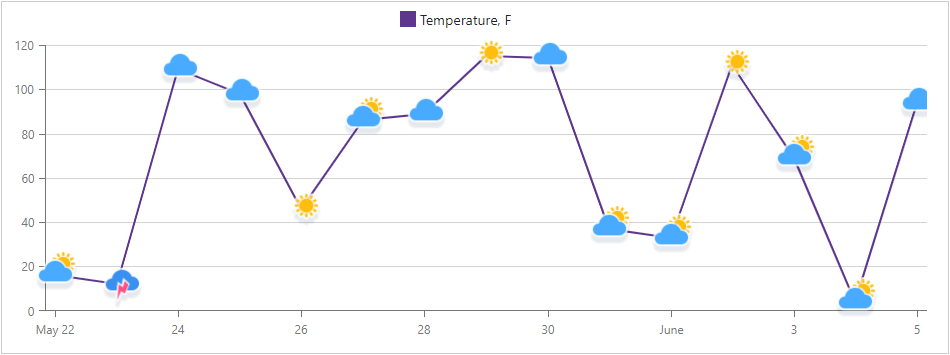
Line series display data as points joined by line segments. Use the DxChartSeriesPointImage component to display all series points as custom images. You can associate different images with different points but every point should have an assigned image.
You can also handle the chart’s CustomizeSeriesPoint event to override images for individual points.
The following example demonstrates how to specify point images based on CloudCover field value that comes from the chart’s data source. Images with the corresponding names are stored in the wwwroot/images folder.
<DxChart Data="@WeatherForecasts" CustomizeSeriesPoint="@PreparePointImage">
    <DxChartLineSeries AggregationMethod="@(i => (int)i.Average())"
                       ValueField="@((WeatherForecast i) => i.TemperatureF)"
                       ArgumentField="@(i => i.Date.Date)"
                       Name="Temperature, F">
        <DxChartSeriesPoint>
            <DxChartSeriesPointImage Width="50" Height="50" />
        </DxChartSeriesPoint>
    </DxChartLineSeries>
    <DxChartLegend Position="RelativePosition.Outside" />
</DxChart>

@code {
    WeatherForecast[] WeatherForecasts;
    ...
    protected void PreparePointImage(ChartSeriesPointCustomizationSettings pointSettings) {
        IEnumerable<WeatherForecast> dataItems = pointSettings.Point.DataItems.Cast<WeatherForecast>();
        var weatherType = dataItems.GroupBy(x => x.CloudCover).OrderByDescending(x => x.Count()).First().Key;
        pointSettings.PointAppearance.Image.Url = $"images/{weatherType}.png";
    }
}
