DxChartStackedBarSeriesBase<T, TArgument, TValue>.Stack Property
Specifies the stack in a side-by-side stacked series.
Namespace: DevExpress.Blazor
Assembly: DevExpress.Blazor.v22.1.dll
NuGet Package: DevExpress.Blazor
Declaration
[DefaultValue("default")]
[Parameter]
public string Stack { get; set; }
Property Value
| Type | Default | Description |
|---|---|---|
| String | "default" | The stack identifier. |
Remarks
This property is applicable only to DxChartStackedBarSeries and DxChartFullStackedBarSeries.
If you do not specify the Stack property, the chart displays a single stack for each argument - the control displays a regular stacked or full-stacked bar view.
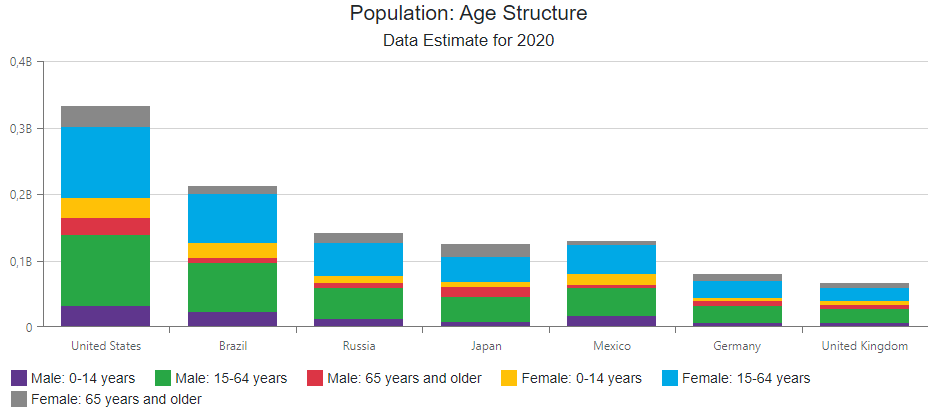
You can initialize the Stack property to display side-by-side stacked charts. For example, the following image shows the Chart with the same settings, except the Stack property specifies gender. The chart then displays side-by-side gender-specific stacks.
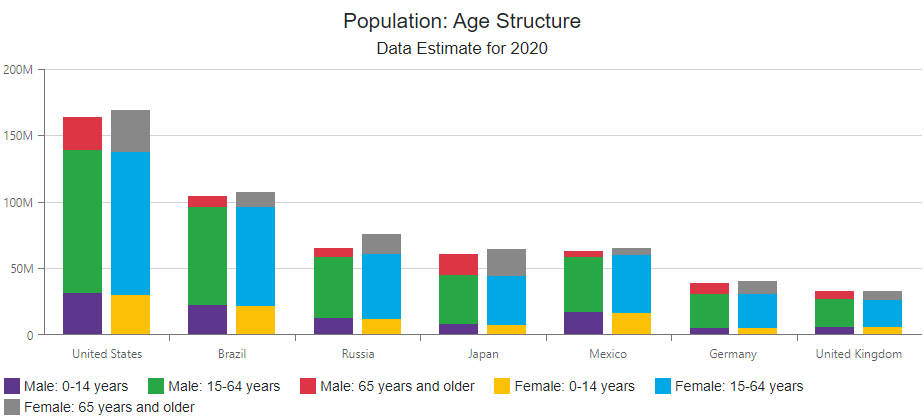
Side-by-side display enhances chart readability and allows users to compare stacks displayed next to each other.
The number of stacks is unlimited.
The following code snippet creates a side-by-side chart as in the image above. The example uses the Common series and Data property to define the stacked bar template. Alternatively, you can omit the template definition. Define all series and specify the Stack property for each series individually.
<DxChart T="PopulationAgeStructureItem"
         Data="@ChartsData"
         Width="100%">
    <DxChartCommonSeries T="PopulationAgeStructureItem"
                         TArgument="string"
                         TValue="int"
                         TGroup="string"
                         NameField='pasi => $"{pasi.Gender}: {pasi.AgeGroup}"'>
        <SeriesTemplate Context="settings">
            <DxChartStackedBarSeries Settings="@settings"
                                     ArgumentField="pasi => pasi.Country"
                                     ValueField="pasi => pasi.Population"
                                     Stack="@settings.Data.First().Gender" />
        </SeriesTemplate>
    </DxChartCommonSeries>
    @* ... *@
</DxChart>

@code {
    IEnumerable<PopulationAgeStructureItem> ChartsData;
    protected override async Task OnInitializedAsync()
    {
        ChartsData = await DataProvider.QueryData();
    }
}