DxChartAxis<TModel>.Type Property
Specifies an axis type.
Namespace: DevExpress.Blazor
Assembly: DevExpress.Blazor.v22.1.dll
NuGet Package: DevExpress.Blazor
Declaration
[DefaultValue(ChartAxisType.Auto)]
[Parameter]
public ChartAxisType Type { get; set; }
Property Value
| Type | Default | Description |
|---|---|---|
| ChartAxisType | Auto | A ChartAxisType enumeration value. |
Available values:
| Name | Description |
|---|---|
| Auto | Automatically detects the series’s data type and uses it to render the axis. For integer and float data types, displays numeric arguments/values divided by ticks. For other data types, displays discrete arguments/values that correspond to chart points. |
| Continuous | The axis uses a continuous scale to display numeric and date-time values. |
| Discrete | Displays discrete arguments/values that correspond to chart points. |
| Logarithmic | Displays numeric arguments/values that grow exponentially. Each axis argument/value equals to the specified logarithm base raised to a power (for instance, 10⁻², 10⁻¹, 10⁰, 10¹, 10⁻², etc.). |
Remarks
The DxChart<T> component automatically detects the first series’s data type and uses it to render X (argument) and Y (value) axes.
Use the Type property to specify the type of an axis. The following types are available:
Value | Description |
|---|---|
Auto (Default) | For integer and float data types, displays numeric arguments/values divided by ticks (the Continuous type). For other data types, displays discrete arguments/values that correspond to chart points (the Discrete type). |
Displays numeric arguments/values divided by ticks. | |
Displays discrete arguments/values that correspond to chart points. | |
Displays numeric arguments/values that grow exponentially. Each axis argument/value equals to the LogarithmBase value raised to a power (for instance, 10⁻², 10⁻¹, 10⁰, 10¹, 10⁻², etc.). |
You can also use the DxChartArgumentAxis.ArgumentType and DxChartValueAxis.ValueType properties to cast arguments and values to the specified data type.
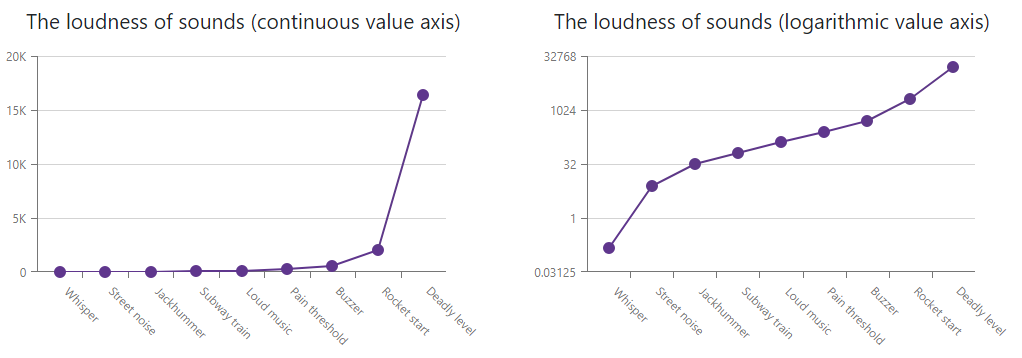
The following example demonstrates how to display argument axes of the Discrete type, and value axes of Continuous and Logarithmic types, respectively. The LogarithmBase property for the second chart is set to 2.
<DxChart Data="@GetData()">
    <DxChartTitle Text="@($"The loudness of sounds (continuous value axis)")" />
    <DxChartLegend Visible="false" />
    <DxChartArgumentAxis Type="ChartAxisType.Discrete" />
    <DxChartValueAxis Type="ChartAxisType.Continuous" />
    <DxChartLineSeries ArgumentField="@((DataPoint s) => s.Argument)" ValueField="@((DataPoint s) => s.Value)" />
</DxChart>
<DxChart Data="@GetData()">
    <DxChartTitle Text="@($"The loudness of sounds (logarithmic value axis)")" />
    <DxChartLegend Visible="false" />
    <DxChartArgumentAxis Type="ChartAxisType.Discrete" />
    <DxChartValueAxis Type="ChartAxisType.Logarithmic" LogarithmBase="2" />
    <DxChartLineSeries ArgumentField="@((DataPoint s) => s.Argument)" ValueField="@((DataPoint s) => s.Value)" />
</DxChart>