TdxChartSimpleSeries Class
A series in a simple diagram.
Declaration
TdxChartSimpleSeries = class(
    TdxChartCustomSeries
)
Remarks
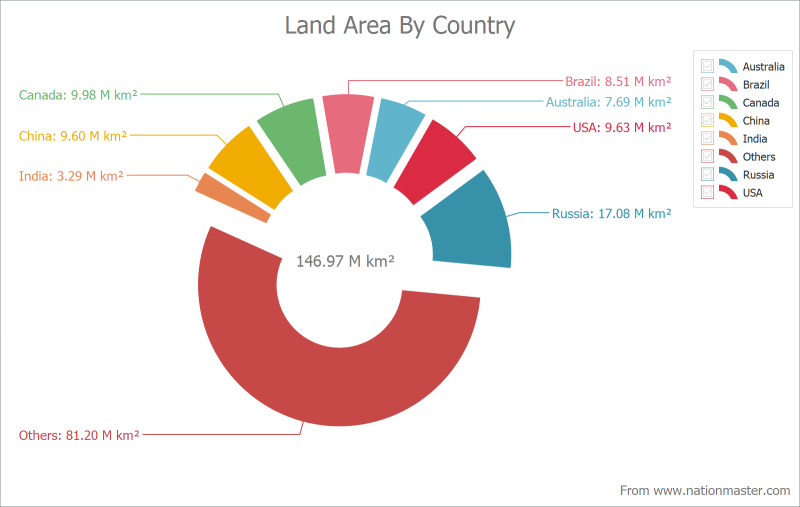
Simple series display values as portions of a shape, such as a pie or doughnut. Simple series are useful when you need to compare percentage values of different point arguments in the same series.
Supported Simple Series Views
A series View determines how a simple diagram displays series.[1] A diagram can display multiple series with different Views and individual View appearance settings. You can use the ViewType or ViewClass property to switch between compatible Views in any existing series and display the same data in a different manner at any time.
Pie View
The Pie View displays series values as slices of a circle whose radial angles reflect shares of all series values in relation to their total.

Doughnut View
The Doughnut View is identical to the Pie View but has a hole in its center.

Main API Members
The list below outlines key members of the TdxChartSimpleSeries class that allow you to configure series.
Appearance and Behavior Settings
- CheckableInLegend
- Specifies if users can hide or display the XY series in the chart legend.
- EmptyPointsDisplayMode
- Specifies how the Chart control displays empty points in the series.
- Index
- Specifies the index of the series in its diagram.
- StoredName
- Specifies the custom name for saving series data to a stream.
- View
- Provides access to the active series View settings.
Data-Related Settings
- DataBindingClass | DataBindingType
- Switch between data access modes.
- DataBinding
- Provides access to data binding settings.
- Points
- Provides access to the series point collection.
- SortBy | SortOrder
- Sort data points by values or arguments in ascending or descending order.
- TopNOptions
- Specifies how the series determines points with highest or lowest values and displays them.
General-Purpose API Members
- AssignFrom
- Updates all series settings from the specified source.
- BeginUpdate | EndUpdate | CancelUpdate
- Allow you to avoid excessive redraw operations during batch data and appearance changes.
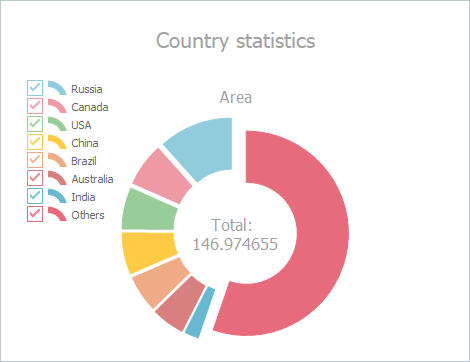
Code Example: Create an Unbound Doughnut Series
The following code example creates a simple series with the Doughnut View and populates it with data points in unbound mode:
uses cxDataStorage;  // Declares the TcxStringValueType class
// ...
var
  ASimpleDiagram: TdxChartSimpleDiagram;
  ASimpleSeries: TdxChartSimpleSeries;
  ADoughnutView: TdxChartSimpleSeriesDoughnutView;
  ADataBinding: TdxChartSimpleSeriesUnboundDataBinding;
begin
  dxChartControl1.BeginUpdate;  // Initiates the following batch change
  try
    ASimpleDiagram := dxChartControl1.AddDiagram<TdxChartSimpleDiagram>('Country statistics');
    ASimpleDiagram.Title.Appearance.FontOptions.Size := 16;
    ASimpleDiagram.Legend.AlignmentHorz := TdxChartLegendAlignment.Near; // Moves the legend pane
    ASimpleSeries := ASimpleDiagram.AddSeries('Area');  // Creates a simple series
    // Displays series data point arguments on the diagram legend pane
    ASimpleSeries.ShowInLegend := TdxChartSeriesShowInLegend.Diagram;
    ASimpleSeries.ViewClass := TdxChartSimpleSeriesDoughnutView;  // Selects the Doughnut series View
    // Selects the unbound data access mode
    ASimpleSeries.DataBindingClass := TdxChartSimpleSeriesUnboundDataBinding;
    ADataBinding := ASimpleSeries.DataBinding as TdxChartSimpleSeriesUnboundDataBinding;
    ADataBinding.ArgumentField.ValueTypeClass := TcxStringValueType;  // Selects the string data type
    ASimpleSeries.Title.Text := 'Area';  // Specifies the series title
    // Populates the unbound simple series with data points
    ASimpleSeries.Points.Add('Russia', 17.0752);
    ASimpleSeries.Points.Add('Canada', 9.98467);
    ASimpleSeries.Points.Add('USA', 9.63142);
    ASimpleSeries.Points.Add('China', 9.59696);
    ASimpleSeries.Points.Add('Brazil', 8.511965);
    ASimpleSeries.Points.Add('Australia', 7.68685);
    ASimpleSeries.Points.Add('India', 3.28759);
    ASimpleSeries.Points.Add('Others', 81.2);
    // Customizes appearance of the Doughnut series View
    ADoughnutView := ASimpleSeries.View as TdxChartSimpleSeriesDoughnutView;
    ADoughnutView.HoleRadius := 50;
    ADoughnutView.ExplodedValueOptions.Mode := TdxChartExplodedValueMode.All;
  finally
    dxChartControl1.EndUpdate;  // Calls EndUpdate regardless of the batch operation's success
  end;
Series Deletion
To delete all series in a diagram, call its DeleteAllSeries procedure. To delete an individual series, release it directly in code (call the Free procedure in Delphi or use the delete keyword in C++Builder).
Related Compiled Demo
To see a simple series in action, run the Chart Control demo in the VCL Demo Center installed with compiled DevExpress VCL demos. Select Pie or Doughnut in the left sidebar.
Tip
Compiled DevExpress demos ship with source code installed in the Public Documents folder (%Public%) for all users (default). You can find all project and source code files for the Chart control in the following folder:
%Public%\Documents\DevExpress VCL Demos\MegaDemos\Product Demos\ExpressChart
Direct TdxChartSimpleSeries Class Reference
The following public API members reference a TdxChartSimpleSeries object:
- TdxChartSimpleDiagram.Series
- Provides indexed access to all simple series in the diagram.
- TdxChartSimpleDiagram.VisibleSeries
- Provides indexed access to all visible series in the diagram.