TdxChartCustomSeries.AssignFrom(TdxChartCustomSeries) Method
Updates all series settings from the specified source.
Declaration
procedure AssignFrom(ASource: TdxChartCustomSeries); virtual;Parameters
| Name | Type | Description |
|---|---|---|
| ASource | TdxChartCustomSeries | The source series. |
Remarks
Call the AssignFrom procedure to copy settings between series. For example, AssignFrom is useful when you need to apply the same appearance settings to multiple series.
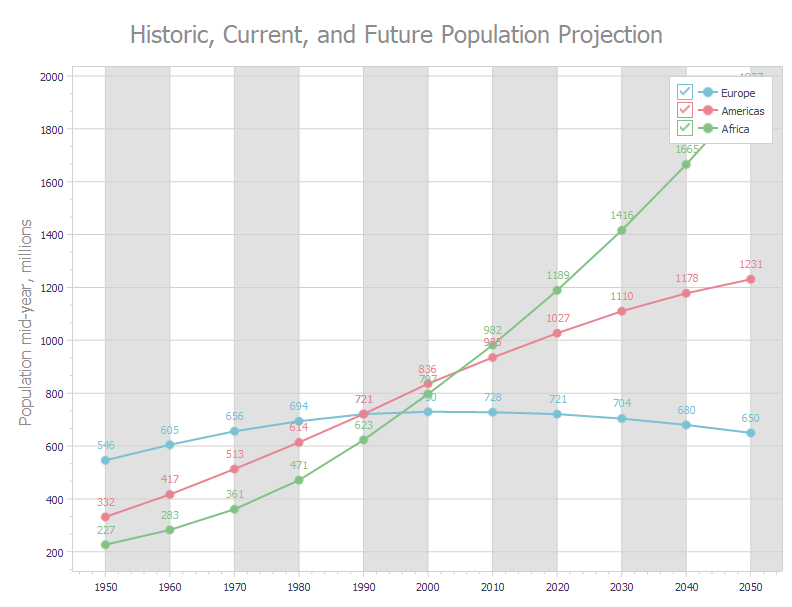
Code Example: Bound Mode
The following code example creates three line series with identical appearance settings in bound mode:
var
  AXYDiagram: TdxChartXYDiagram;
  AXYSeriesAmericas, AXYSeriesEurope, AXYSeriesAfrica: TdxChartXYSeries;
  ALineView: TdxChartXYSeriesLineView;
  ADataBinding: TdxChartXYSeriesDBDataBinding;
begin
  dxChartControl1.BeginUpdate;  // Initiates the following batch change
  try
    dxChartControl1.Titles.Add.Text := 'Historic, Current, and Future Population Projection';
    AXYDiagram := dxChartControl1.AddDiagram<TdxChartXYDiagram>;
    AXYDiagram.Axes.AxisY.Title.Text := 'Population mid-year, millions';
    AXYDiagram.Axes.AxisX.Interlaced := True;
    AXYSeriesEurope := AXYDiagram.AddSeries('Europe');  // Creates a new series with the caption "Europe"
    AXYSeriesEurope.ShowInLegend := TdxChartSeriesShowInLegend.Diagram;
    AXYSeriesEurope.DataBindingClass := TdxChartXYSeriesDBDataBinding;
    ADataBinding := AXYSeriesEurope.DataBinding as TdxChartXYSeriesDBDataBinding;
    ADataBinding.DataSource := dsPopulation;  // Assigns a data source
    ADataBinding.DataSource.DataSet := mdPopulation;  // Assigns a dataset
    ADataBinding.DataSource.DataSet.Active := True;  // Enables the assigned dataset
    ADataBinding.ArgumentField.FieldName := 'Year';  // Specifies the source dataset field for arguments
    ADataBinding.ValueField.FieldName := 'Europe';  // Specifies the source dataset field for values
    AXYSeriesEurope.ViewClass := TdxChartXYSeriesLineView;  // Selects the Line series View
    ALineView := AXYSeriesEurope.View as TdxChartXYSeriesLineView;
    ALineView.Markers.Visible := True;  // Displays value markers
    ALineView.ValueLabels.Visible := True;  // Displays value labels
    ALineView.Appearance.StrokeOptions.Width := 2;  // Increases line width
    AXYSeriesAmericas := AXYDiagram.AddSeries;  // Creates a new series with the default settings
    AXYSeriesAmericas.AssignFrom(AXYSeriesEurope);  // Copies all settings from the "Europe" series
    AXYSeriesAmericas.Caption := 'Americas';  // Defines a different series caption
    // Specifies a different source dataset field for values
    ADataBinding := AXYSeriesAmericas.DataBinding as TdxChartXYSeriesDBDataBinding;
    ADataBinding.ValueField.FieldName := 'Americas';
    AXYSeriesAfrica := AXYDiagram.AddSeries;  // Creates a new series with the default settings
    AXYSeriesAfrica.AssignFrom(AXYSeriesEurope);  // Copies all settings from the "Europe" series
    AXYSeriesAfrica.Caption := 'Africa';  // Defines a different series caption
    // Specifies a different source dataset field for values
    ADataBinding := AXYSeriesAfrica.DataBinding as TdxChartXYSeriesDBDataBinding;
    ADataBinding.ValueField.FieldName := 'Africa';
  finally
    dxChartControl1.EndUpdate;  // Calls EndUpdate regardless of the batch operation's success
  end;
end;
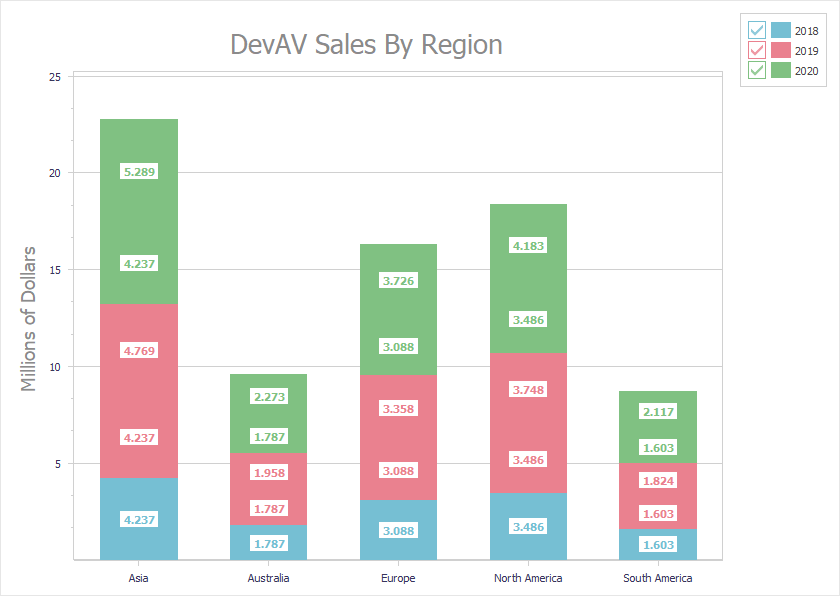
Code Example: Unbound Mode
The following code example creates three stacked bar series with identical appearance settings in unbound data access mode:
uses cxDataStorage;  // Declares the TcxStringValueType class
// ...
var
  AXYDiagram: TdxChartXYDiagram;
  AXY2018Series, AXY2019Series, AXY2020Series: TdxChartXYSeries;
  AStackedBarView: TdxChartXYSeriesStackedBarView;
  ADataBinding: TdxChartXYSeriesUnboundDataBinding;
begin
  dxChartControl1.BeginUpdate;  // Initiates the following batch change
  try
    AXYDiagram := dxChartControl1.AddDiagram<TdxChartXYDiagram>('DevAV Sales By Region');
    AXYDiagram.Title.Appearance.FontOptions.Size := 20;
    AXYDiagram.Axes.AxisY.Title.Text := 'Millions of Dollars';
    AXYDiagram.Axes.AxisY.Title.Appearance.FontOptions.Size := 14;
    AXY2018Series := AXYDiagram.AddSeries('2018');  // Creates a new series with the caption "2018"
    // Selects the unbound data access mode
    AXY2018Series.DataBindingClass := TdxChartXYSeriesUnboundDataBinding;
    ADataBinding := AXY2018Series.DataBinding as TdxChartXYSeriesUnboundDataBinding;
    // Selects the string data type for arguments
    ADataBinding.ArgumentField.ValueTypeClass := TcxStringValueType;
    AXY2018Series.ViewClass := TdxChartXYSeriesStackedBarView;  // Selects the Stacked Bar series View
    AStackedBarView := AXY2018Series.View as TdxChartXYSeriesStackedBarView;
    AStackedBarView.ValueLabels.Visible := True;  // Displays value labels on bars
    AStackedBarView.ValueLabels.TextFormat := '{V:0.000}';  // Changes the number display format
    AStackedBarView.ValueLabels.Appearance.FontOptions.Bold := True;
    AXY2018Series.Points.Add('Asia', 4.2372);
    AXY2018Series.Points.Add('Australia', 1.7871);
    AXY2018Series.Points.Add('Europe', 3.0884);
    AXY2018Series.Points.Add('North America', 3.4855);
    AXY2018Series.Points.Add('South America', 1.6027);
    AXY2019Series := AXYDiagram.AddSeries;  // Creates a new series with the default settings
    AXY2019Series.AssignFrom(AXY2018Series);  // Copies all settings from the "2018" series
    AXY2019Series.Caption := '2019';  // Defines a different series caption
    AXY2019Series.Points.Add('Asia', 4.7685);
    AXY2019Series.Points.Add('Australia', 1.9576);
    AXY2019Series.Points.Add('Europe', 3.3579);
    AXY2019Series.Points.Add('North America', 3.7477);
    AXY2019Series.Points.Add('South America', 1.8237);
    AXY2020Series := AXYDiagram.AddSeries('2020');  // Creates a new series with the default settings
    AXY2020Series.AssignFrom(AXY2018Series);  // Copies all settings from the "2018" series
    AXY2020Series.Caption := '2020';  // Defines a different series caption
    AXY2020Series.Points.Add('Asia', 5.289);
    AXY2020Series.Points.Add('Australia', 2.2727);
    AXY2020Series.Points.Add('Europe', 3.7257);
    AXY2020Series.Points.Add('North America', 4.1825);
    AXY2020Series.Points.Add('South America', 2.1172);
  finally
    dxChartControl1.EndUpdate;  // Calls EndUpdate regardless of the batch operation's success
  end;
end;
See Also