TdxChartControl Class
A Chart control.
Declaration
TdxChartControl = class(
    TdxCustomChartControl
)
Remarks
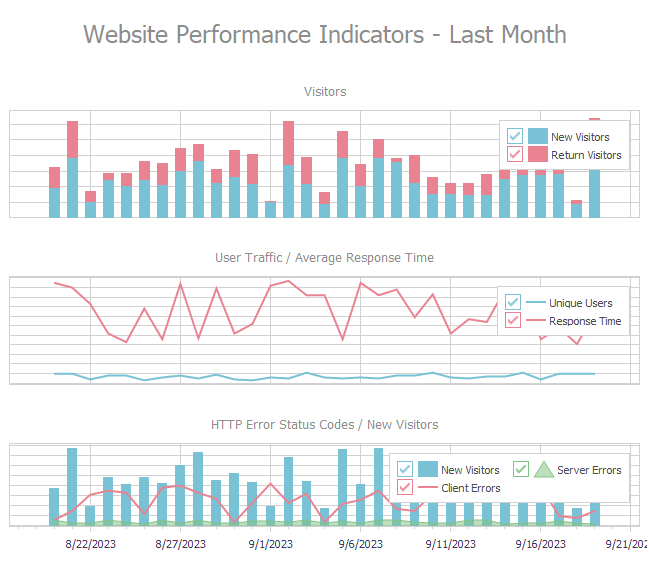
The Chart control can display one or more diagrams. Each diagram holds data series and visualizes those series with the help of different View types:
Available Diagram Types
- XY Diagram
Displays series on a two-dimensional surface with argument and value axes (X-axis and Y-axis). An XY diagram can plot Area, Bar, and Line series.
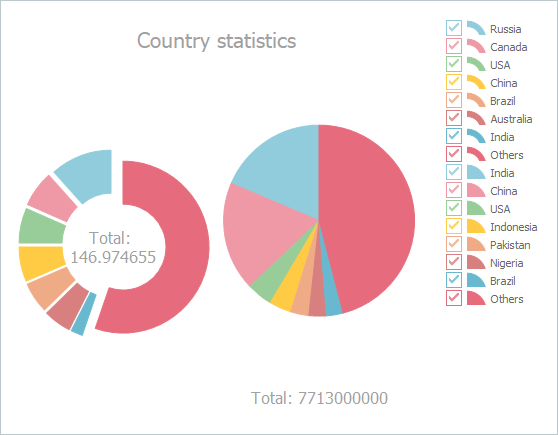
- Simple Diagram
Displays series as Pie or Doughnut charts.
Bind to Data
All supported series can work in the following data access modes:
- Bound
- A chart series connects to a dataset and loads all data records into memory.
- Unbound
- A chart series is not bound to a dataset. You need to populate series with data points manually.
Main API Members
The list below outlines key members of the TdxChartControl class. These members allow you to manage diagrams and customize Chart control appearance settings.
Appearance and Behavior
- Appearance | LookAndFeel
- Provide access to general appearance settings.
- BiDiMode
- Specifies the active bidirectional mode.
- BorderStyle
- Specifies if the skin-dependent border is visible.
- CalculateHitTest
- Calculates HitTest information for any point within the Chart control client area.
- Font | ParentFont
- Define font settings at the Chart control level.
- HitTest | OnHotTrackElement | OnMouseMove
- Allow you to identify the visual Chart element under the mouse pointer and respond to hot-tracking different visual elements.
- Legend
- Provides access to legend pane settings.
- Palette
Allows you to switch between color palettes where color sets are applied to individual simple series values and XY series.
If the active palette does not have enough explicitly defined colors to draw all affected series or series values differently, the Chart control generates interpolated colors based on existing colors.
Tip
Use the TdxChartPaletteRepository component to create, manage, and apply custom palettes. All stored custom palettes are available in the same list as predefined palettes.
- Titles
- Allows you to manage Chart control titles.
- ToolTips
- Allows you to switch between tooltip display modes at the Chart control level and customize general tooltip settings.
- ZoomOptions | ScrollOptions
- Provide access to zoom and scroll settings for all XY diagrams in the control.
Diagram Management
- AddDiagram<T>(string) | AddDiagram(TdxChartDiagramClass,string)
- Create a new diagram.
- DiagramCount | VisibleDiagramCount
- Return the total number of diagrams and the number of currently visible diagrams.
- VisibleDiagrams | Diagrams
- Provide access to visible and hidden diagrams by their indexes.
Tip
To delete a diagram, release it directly in code (call the Free procedure in Delphi or use the delete keyword in C++Builder).
Data Import and Export
- ExportToImage
- These two overloaded methods save the current state of the Chart control client area as an individual image in any supported format.
- ExportToBMP | ExportToEMF | ExportToGIF | ExportToJPEG | ExportToPNG | ExportToSVG | ExportToTIFF | ExportToWMF
- Export the current state of the Chart control client area as an individual image in corresponding formats.
- ExportToDOCX | ExportToXLSX
- Save the current state of the Chart control client area as an inline or floating image container in the resulting DOCX or XLSX document.
Note
The result of all export to image operations depends on the pixel size of the Chart control client area on the current screen.
Refer to individual method descriptions and the following help topic for details: VCL Chart Data Export.
- SaveToStream | LoadFromStream
- Allow you to store series data from all diagrams in a memory stream. Since these methods work only with series data, you need to create and configure all required diagrams and series to successfully load previously saved data.
Print Functionality
To print the Chart control and export its content as a PDF document, add a TdxComponentPrinter component to your project and create a Chart report link.
Refer to the following topic for detailed information and code examples: Chart Print Functionality.
General-Purpose API Members
- BeginUpdate | EndUpdate | CancelUpdate
- Allow you to avoid excessive redraw operations during batch data and appearance changes.
- OnChange
- Allows you to respond to any setting or diagram change in the Chart control.
Code Example: Create an XY Diagram with Unbound Series
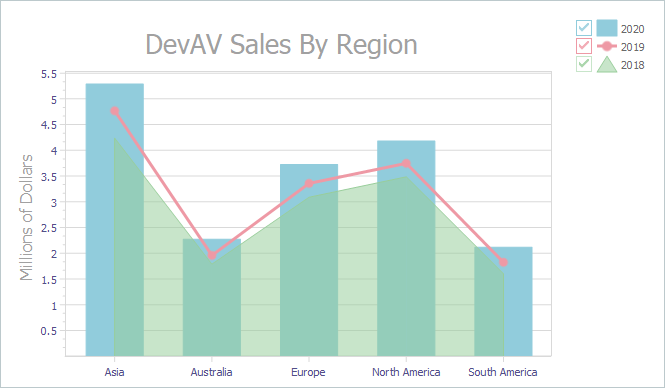
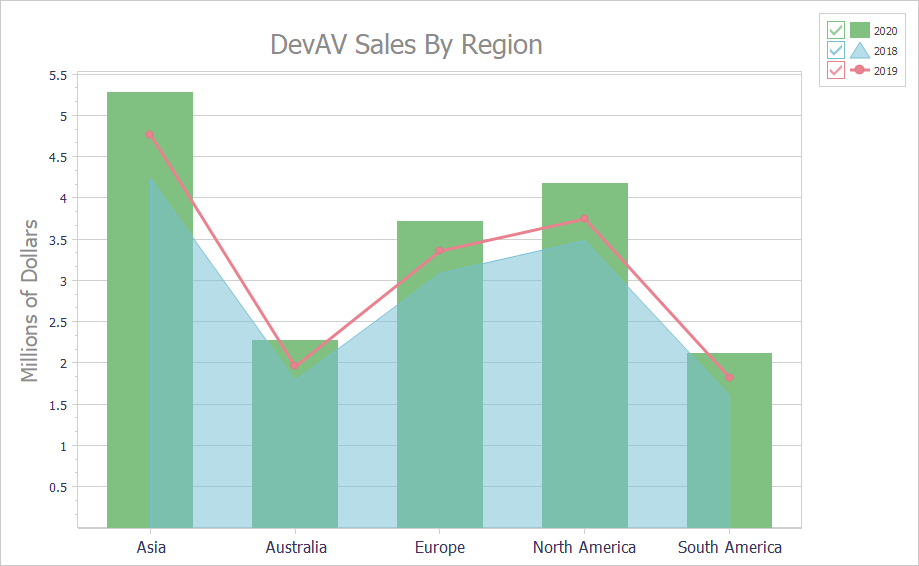
The following code example creates an XY diagram with three series that use Area, Bar, and Line View types:
var
  AXYDiagram: TdxChartXYDiagram;
  AXYSeries: TdxChartXYSeries;
begin
  dxChartControl1.BeginUpdate;  // Initiates the following batch change
  try
    AXYDiagram := dxChartControl1.AddDiagram<TdxChartXYDiagram>('DevAV Sales By Region');
    AXYDiagram.Title.Appearance.FontOptions.Size := 20;
    AXYDiagram.Axes.AxisY.Title.Text := 'Millions of Dollars';
    AXYDiagram.Axes.AxisY.Title.Appearance.FontOptions.Size := 16;
    AXYDiagram.Axes.AxisY.ValueLabels.Appearance.FontOptions.Size := 10;
    AXYDiagram.Axes.AxisX.ValueLabels.Appearance.FontOptions.Size := 12;
    AXYSeries := AXYDiagram.AddSeries('2018');
    AXYSeries.DataBindingType := 'Unbound';  // Selects the unbound data access mode
    TdxChartXYSeriesUnboundDataBinding(AXYSeries.DataBinding).ArgumentField.ValueType := 'string';
    AXYSeries.ViewType := 'Area';  // Selects the Area series View
    AXYSeries.Points.Add('Asia', 4.2372);
    AXYSeries.Points.Add('Australia', 1.7871);
    AXYSeries.Points.Add('Europe', 3.0884);
    AXYSeries.Points.Add('North America', 3.4855);
    AXYSeries.Points.Add('South America', 1.6027);
    AXYSeries := AXYDiagram.AddSeries('2019');
    AXYSeries.DataBindingType := 'Unbound';  // Selects the unbound data access mode
    TdxChartXYSeriesUnboundDataBinding(AXYSeries.DataBinding).ArgumentField.ValueType := 'string';
    AXYSeries.ViewType := 'Line';  // Selects the Line series View
    AXYSeries.Points.Add('Asia', 4.7685);
    AXYSeries.Points.Add('Australia', 1.9576);
    AXYSeries.Points.Add('Europe', 3.3579);
    AXYSeries.Points.Add('North America', 3.7477);
    AXYSeries.Points.Add('South America', 1.8237);
    TdxChartXYSeriesLineView(AXYSeries.View).Appearance.StrokeOptions.Width := 3;
    TdxChartXYSeriesLineView(AXYSeries.View).Markers.Kind := TdxChartXYMarkerKind.Circle;
    TdxChartXYSeriesLineView(AXYSeries.View).Markers.Visible := True;
    AXYSeries := AXYDiagram.AddSeries('2020');
    AXYSeries.DataBindingType := 'Unbound';  // Selects the unbound data access mode
    TdxChartXYSeriesUnboundDataBinding(AXYSeries.DataBinding).ArgumentField.ValueType := 'string';
    AXYSeries.ViewType := 'Bar';  // Selects the Bar series View
    AXYSeries.Points.Add('Asia', 5.289);
    AXYSeries.Points.Add('Australia', 2.2727);
    AXYSeries.Points.Add('Europe', 3.7257);
    AXYSeries.Points.Add('North America', 4.1825);
    AXYSeries.Points.Add('South America', 2.1172);
    AXYSeries.Index := 0; // Moves the created bar series to the innermost layer
  finally
    dxChartControl1.EndUpdate;  // Calls EndUpdate regardless of the batch operation's success
  end;
end;
Related Compiled Demo
To see the Chart control in action, run the Chart Control demo in the VCL Demo Center installed with compiled DevExpress VCL demos. Click different items in the sidebar on the left to display different diagram and series types.
Compiled DevExpress demos ship with source code installed in the Public Documents folder (%PUBLIC%) for all users (default). You can find all project and source code files for the Chart Control demo in the following folder:
%PUBLIC%\Documents\DevExpress VCL Demos\MegaDemos\Product Demos\ExpressCharts\
Print Link
The TdxChartControlReportLink class implements the Chart control’s print functionality.