TdxChartExplodedValueOptions.Mode Property
In This Article
Specifies what pie or doughnut slices are displayed separately from their neighbors.
#Declaration
Delphi
property Mode: TdxChartExplodedValueMode read; write; default TdxChartExplodedValueMode.None;#Property Value
| Type | Default | Description |
|---|---|---|
| Tdx |
None | The active slice display mode for an exploded Pie or Doughnut series. |
#Remarks
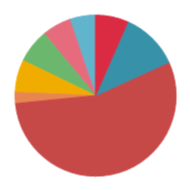
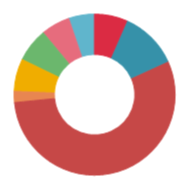
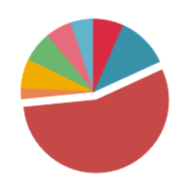
Use the Mode property to separate all or certain pie or doughnut slices from their neighbors.
#Examples
| Value | Example[1] | Example[2] |
|---|---|---|
| Tdx |
 |
 |
| Tdx |
 |
 |
| Tdx |
 |
 |
Refer to the TdxChartExplodedValueMode type description for the full list of available fill modes.
#Default Value
The Mode property’s default value is TdxChartExplodedValueMode.
Footnotes
See Also