Chart Appearance Customization
- 3 minutes to read
The Chart control has multiple appearance customization options at different UI element levels – from global settings to individual titles, labels, and series points. You can configure general appearance settings, apply predefined and custom palettes, and handle dedicated events to customize individual visual elements.
Appearance Settings
Every visual element has a set of general appearance settings accessible through the corresponding Appearance property. This property allows you to change font, margin, padding, fill, and outline settings depending on the visual element type and its purpose in the Chart control.
The list below enumerates Appearance properties accessible through different visual elements at different levels. Different visual elements implement different subsets of options declared in the base TdxChartVisualElementAppearance class.
Control Settings
- TdxCustomChartControl.Appearance
- Provides access to the Chart control’s appearance settings.
- TdxChartCrosshairLabels.Appearance
- Provides access to crosshair label appearance settings.
- TdxChartCrosshairLines.Appearance
- Provides access to crosshair line appearance settings.
- TdxChartTitleCollectionItem.Appearance
- Provides access to general title appearance settings.
Common Settings
- TdxChartCustomLegend.Appearance
- Provides access to general legend pane appearance settings.
- TdxChartVisualElementTitle.Appearance
- Provides access to general title appearance settings.
Diagram Settings
- TdxChartCustomDiagram.Appearance
- Provides access to diagram appearance settings.
Series Settings
- TdxChartSeriesValueLabels.Appearance
- Provides access to general appearance settings of series value labels.
- TdxChartSimpleSeriesCustomView.Appearance
- Provides access to Simple View appearance settings.
- TdxChartAxisValueLabels.Appearance
- Provides access to appearance settings of value labels.
- TdxChartCrosshairAxisLabels.Appearance
- Provides access to the general appearance settings of crosshair axis labels.
- TdxChartCustomAxis.Appearance
- Provides access to general axis appearance options.
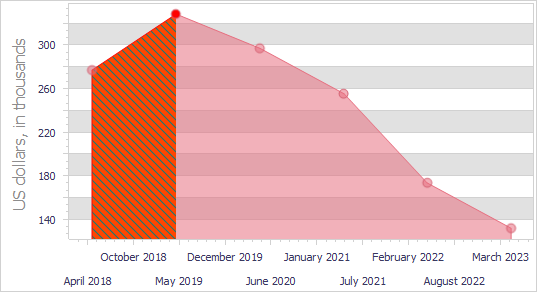
- TdxChartXYSeriesAreaView.Appearance
- Provides access to Area View appearance settings.
- TdxChartXYSeriesCustomBarView.Appearance
- Provides access to bar appearance settings.
- TdxChartXYSeriesLineMarkers.Appearance
- Provides access to general appearance settings of value markers.
- TdxChartXYSeriesLineView.Appearance
- Provides access to line appearance settings.
Palettes
The Chart control allows you to apply predefined and custom palettes to XY series and individual points in simple series.
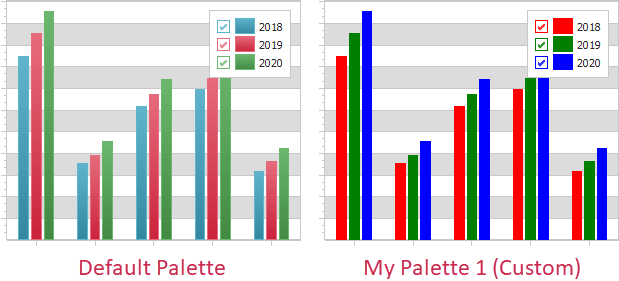
Refer to the following topic for detailed information on all available options: Chart Palettes.
Customization Events
In addition to general appearance settings and palettes, the Chart control has dedicated customization events that allow you to change the appearance of individual visual elements based on certain conditions or events in your application. Any changes made in handlers of these events have higher priority than all other appearance customization options.
The following Chart appearance customization events occur every time the Chart control is about to determine how to draw the corresponding visual element:
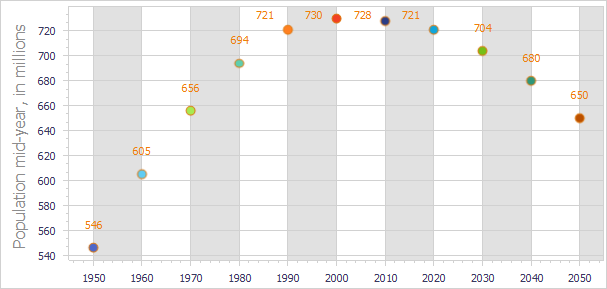
- TdxChartCustomDiagram.OnGetSeriesPointDrawParameters
- Allows you to customize the appearance of individual series points.
- TdxChartCustomDiagram.OnGetValueLabelDrawParameters
- Allows you to customize series value labels.
- TdxChartSimpleDiagram.OnGetTotalLabelDrawParameters
- Allows you to customize individual total labels in the diagram.
Refer to the following topic for detailed information on all available options: Chart Appearance Customization Events.