DxPivotGridDataProvider<T>.ChartDataSource Property
Returns the data source in the format applicable to the DxChart<T> component.
Namespace: DevExpress.Blazor
Assembly: DevExpress.Blazor.v22.1.dll
NuGet Package: DevExpress.Blazor
Declaration
public IEnumerable<IChartDataItem> ChartDataSource { get; }Property Value
| Type | Description |
|---|---|
| IEnumerable<IChartDataItem> | A chart’s data source. |
Remarks
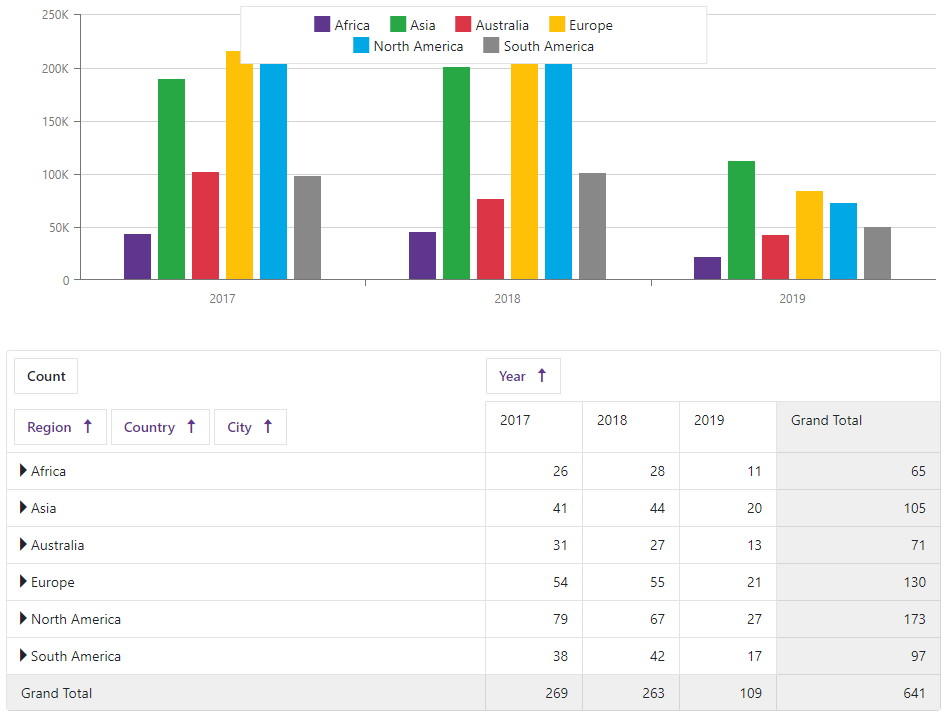
The DxPivotGridDataProvider<T> class allows you to link the Chart and Pivot Grid components. Set the Chart’s Data property to the provider’s ChartDataSource property value.
Do the following to link <DxPivotGrid> with the DxChart<T> component:
- Create a method that asynchronously loads data from an IEnumerable<T> data source (Sales.Load() in this example).
- Create a DxPivotGridDataProvider<T> object based on the created method.
- Bind the Chart to the provider object. Use the
ChartDataSourceproperty. - Bind the Pivot Grid to the provider object. Use the PivotGridDataSource property.
<DxChart Data="@(PivotGridDataProvider.ChartDataSource)">
    <DxChartCommonSeries NameField="@((IChartDataItem s) => s.SeriesName)"
                         ArgumentField="@(s => s.Argument)"
                         ValueField="@(s => s.Value)"
                         SeriesType="ChartSeriesType.Bar" />
</DxChart>

<DxPivotGrid Data="@(PivotGridDataProvider.PivotGridDataSource)">
    <DxPivotGridField Field="@nameof(SaleInfo.Region)" SortOrder="PivotGridSortOrder.Ascending"
        Area="PivotGridFieldArea.Row"></DxPivotGridField>
    <DxPivotGridField Field="@nameof(SaleInfo.Country)" Area="PivotGridFieldArea.Row"></DxPivotGridField>
    <DxPivotGridField Field="@nameof(SaleInfo.City)" Area="PivotGridFieldArea.Row"></DxPivotGridField>
    <DxPivotGridField Field="@nameof(SaleInfo.Date)" GroupInterval="PivotGridGroupInterval.Year"
        Area="PivotGridFieldArea.Column" Caption="Year"> </DxPivotGridField>
    <DxPivotGridField Field="@nameof(SaleInfo.OrderId)" Caption="Count" Area="PivotGridFieldArea.Data"
        SummaryType="PivotGridSummaryType.Count"> </DxPivotGridField>
</DxPivotGrid>

@code {
    DxPivotGridDataProvider<SaleInfo> PivotGridDataProvider = DxPivotGridDataProvider<SaleInfo>.Create(Sales.Load());
}
The Chart shows data from the Pivot Grid’s lowest expanded level. The Chart is updated when a user expands or collapses rows/columns in the Pivot Grid.
See Also