DxChartSeriesLabel.FormatPattern Property
Specifies a string pattern that formats series label text.
Namespace: DevExpress.Blazor
Assembly: DevExpress.Blazor.v22.1.dll
NuGet Package: DevExpress.Blazor
Declaration
[DefaultValue(null)]
[Parameter]
public string FormatPattern { get; set; }
Property Value
| Type | Default | Description |
|---|---|---|
| String | null | An LDML string that formats series label text. |
Remarks
Format patterns can include placeholders in braces with format specifiers separated by a colon, and plain text. For example, “{argument:MMMM}: {value:#.##} °F” where:
- {argument}, {value} - placeholders
- MMMM, #.## - format specifiers
- °F - plain text
See the following section on how to apply such a pattern in code: Example.
The following tables list placeholders you can use in patterns:
Common Placeholders
| Placeholder | Description |
|---|---|
| {argument} | The originalArgument after type cast. |
| {argumentText} | The string that is the argument with an applied format. |
| {originalArgument} | The raw point argument. |
| {originalValue} | The raw point value. |
| {seriesName} | The name of the series to which the point belongs. |
| {value} | The originalValue after type cast. |
| {valueText} | The string that is the value with an applied format. |
Range Series Placeholders
| Placeholder | Description |
|---|---|
| {index} | 0 - if the point is minimum; 1 - if the point is maximum. |
Bubble Series Placeholders
| Placeholder | Description |
|---|---|
| {size} | The bubble point’s size value. |
Stacked Series Placeholders
| Placeholder | Description |
|---|---|
| {percent} | The point’s percentage value. |
| {percentText} | The percentage value with an applied format, and converted to a string. |
| {total} | The sum of all values shown for the argument. |
| {totalText} | The string that is the total with an applied format. |
Financial Series Placeholders
| Placeholder | Description |
|---|---|
| {closeValue} | The originalCloseValue after type cast. |
| {closeValueText} | The string that is the closeValue with an applied format. |
| {highValue} | The originalHighValue after type cast. |
| {highValueText} | The string that is the highValue with an applied format. |
| {lowValue} | The originalLowValue after type cast. |
| {lowValueText} | The string that is the lowValue with an applied format. |
| {openValue} | The originalOpenValue after type cast. |
| {openValueText} | The string that is the openValue with an applied format. |
| {originalCloseValue} | The point’s raw close value. |
| {originalHighValue} | The point’s raw high value. |
| {originalLowValue} | The point’s raw low value. |
| {originalOpenValue} | The point’s raw open value. |
| {reductionValue} | The reduction value. |
| {reductionValueText} | The string that is the reductionValue with an applied format. |
Note
You can specify the DxChartSeriesLabel.ArgumentFormat and DxChartSeriesLabel.ValueFormat properties to format arguments and values, and then use the {argumentText} and {~valueText} placeholders to refer to resulting formatted arguments and values.
Refer to the following topic for the list of format specifiers for date-time and numeric values: LDML patterns.
Example
The following example shows how to format series label text:
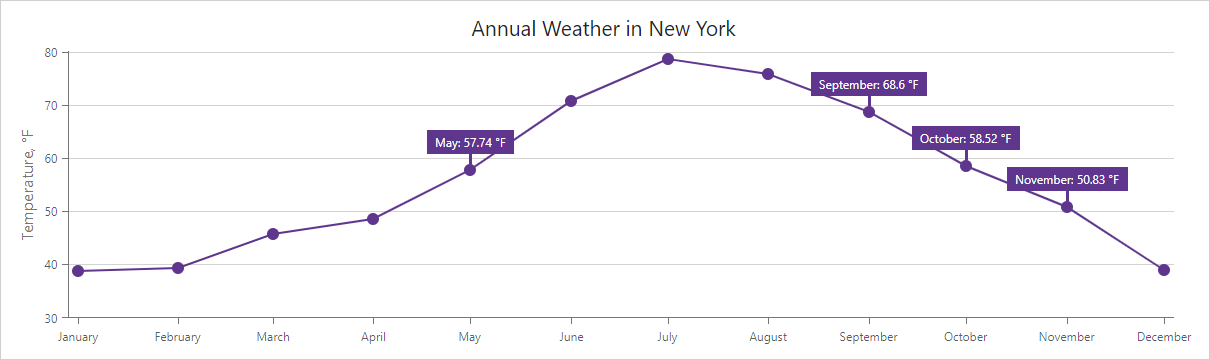
@inject IWeatherSummaryDataProvider WeatherSummaryDataProvider
<DxChart Data="@WeatherForecasts"
         CustomizeSeriesPoint="@PreparePointLabel"
         Width="100%">
    <DxChartLineSeries SummaryMethod="@(i => i.Average())"
                       ValueField="@((DetailedWeatherSummary i) => i.AverageTemperatureF)"
                       ArgumentField="@(i => new DateTime(2000, i.Date.Month, 1))"
                       Name="Temperature, F"
                       Filter="@((DetailedWeatherSummary  i) => i.City == "NEW YORK")">
        <DxChartSeriesLabel Position="RelativePosition.Outside"
                            FormatPattern="{argument:MMMM}: {value:#.##} °F">
            <DxChartSeriesLabelConnector Visible="true"
                                         Width="3" />
        </DxChartSeriesLabel>
    </DxChartLineSeries>
</DxChart>

@code {
    IEnumerable<DetailedWeatherSummary> WeatherForecasts;
    protected override async Task OnInitializedAsync() {
        WeatherForecasts = await WeatherSummaryDataProvider.GetDataAsync();
    }
    protected void PreparePointLabel(ChartSeriesPointCustomizationSettings pointSettings) {
        double value = (double)pointSettings.Point.Value;
        if (value > 50 && value < 70)
            pointSettings.PointLabel.Visible = true;
    }
}