DxChartSeries.Axis Property
Specifies an axis for the series.
Namespace: DevExpress.Blazor
Assembly: DevExpress.Blazor.v22.1.dll
NuGet Package: DevExpress.Blazor
Declaration
[Parameter]
public string Axis { get; set; }
Property Value
| Type | Description |
|---|---|
| String | The name of an axis. |
Remarks
Use the Axis property to specify a custom axis for the series.
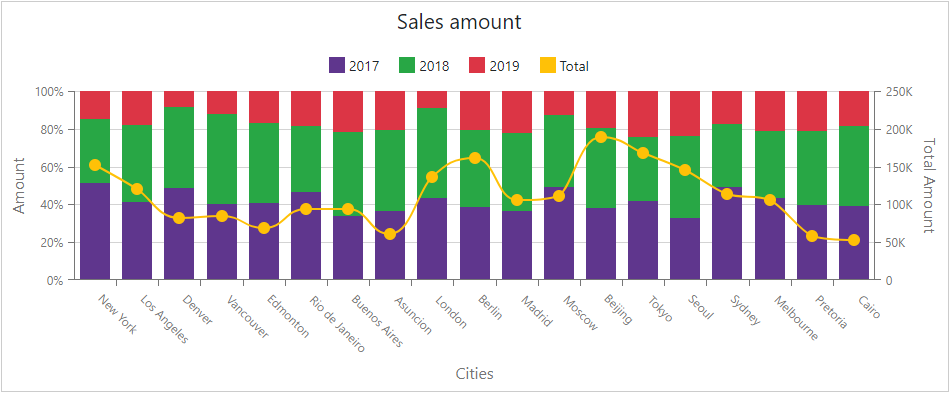
<DxChart Data="@SalesData">
    <DxChartTitle Text="Sales amount" />
    <DxChartValueAxis>
        <DxChartAxisLabel Format="ChartElementFormat.Percent()"></DxChartAxisLabel>
        <DxChartAxisTitle Text="Value Axis Title"></DxChartAxisTitle>
    </DxChartValueAxis>
    <DxChartValueAxis Name="TotalAxis" Alignment="ChartAxisAlignment.Far">
        <DxChartAxisTitle Text="Total Amount"></DxChartAxisTitle>
    </DxChartValueAxis>
    <DxChartArgumentAxis>
        <DxChartAxisTitle Text="Cities"></DxChartAxisTitle>
    </DxChartArgumentAxis>
    <DxChartFullStackedBarSeries Name="2017"
                                 Filter="@((SaleInfo s) => s.Date.Year == 2017)"
                                 SummaryMethod="Enumerable.Sum"
                                 ArgumentField="@(s => s.City)"
                                 ValueField="@(s => s.Amount)" />
    <DxChartFullStackedBarSeries Name="2018"
                                 Filter="@((SaleInfo s) => s.Date.Year == 2018)"
                                 SummaryMethod="Enumerable.Sum"
                                 ArgumentField="@(s => s.City)"
                                 ValueField="@(s => s.Amount)" />
    <DxChartFullStackedBarSeries Name="2019"
                                 Filter="@((SaleInfo s) => s.Date.Year == 2019)"
                                 SummaryMethod="Enumerable.Sum"
                                 ArgumentField="@(s=> s.City)"
                                 ValueField="@(s => s.Amount)" />
    <DxChartSplineSeries Name="Total"
                         SummaryMethod="Enumerable.Sum"
                         ArgumentField="@((SaleInfo s) => s.City)"
                         ValueField="@(s => s.Amount)"
                         Axis="TotalAxis" />
</DxChart>
See Also