TdxChartXYSeriesDBDataBinding Class
Stores data binding settings for an XY series in bound data access mode.
Declaration
TdxChartXYSeriesDBDataBinding = class(
    TdxChartSeriesDBDataBinding
)
Remarks
An XY series is in bound mode when its DataBindingType property is set to 'DB'. In this mode, you can use the DataSource property to bind the series to data. The ArgumentField and ValueField properties specify source fields in the underlying dataset for arguments and values, respectively.
The DataBinding property of an XY series references the TdxChartXYSeriesDBDataBinding class as a TdxChartSeriesCustomDataBinding object if the DataBindingType property of the series is set to 'DB'.
Note
You need to cast the DataBinding property value to the TdxChartXYSeriesDBDataBinding class to access the DataSource, ArgumentField, and ValueField properties.
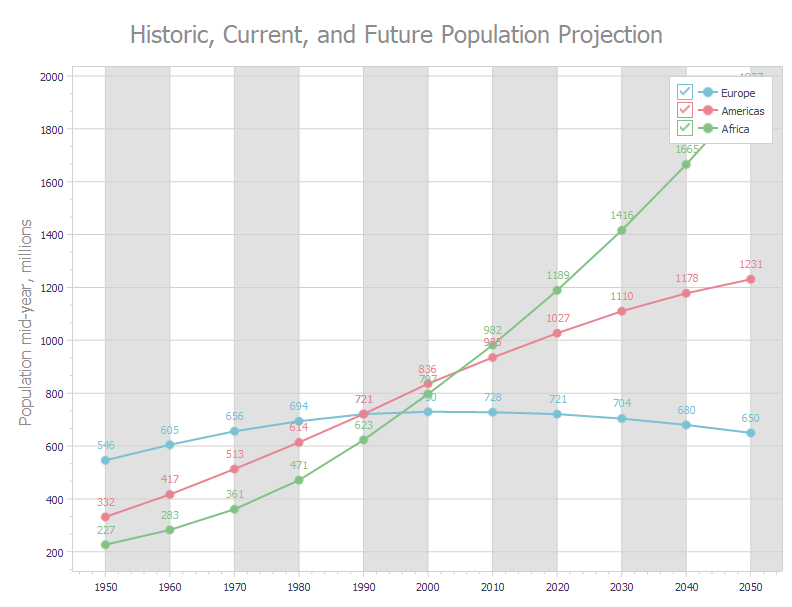
Code Example: Create Three Bound Line Series
The following code example creates three line series with identical appearance settings in bound mode:
var
  AXYDiagram: TdxChartXYDiagram;
  AXYSeriesAmericas, AXYSeriesEurope, AXYSeriesAfrica: TdxChartXYSeries;
  ALineView: TdxChartXYSeriesLineView;
  ADataBinding: TdxChartXYSeriesDBDataBinding;
begin
  dxChartControl1.BeginUpdate;  // Initiates the following batch change
  try
    dxChartControl1.Titles.Add.Text := 'Historic, Current, and Future Population Projection';
    AXYDiagram := dxChartControl1.AddDiagram<TdxChartXYDiagram>;
    AXYDiagram.Axes.AxisY.Title.Text := 'Population mid-year, millions';
    AXYDiagram.Axes.AxisX.Interlaced := True;
    AXYSeriesEurope := AXYDiagram.AddSeries('Europe');  // Creates a new series with the caption "Europe"
    AXYSeriesEurope.ShowInLegend := TdxChartSeriesShowInLegend.Diagram;
    AXYSeriesEurope.DataBindingClass := TdxChartXYSeriesDBDataBinding;
    ADataBinding := AXYSeriesEurope.DataBinding as TdxChartXYSeriesDBDataBinding;
    ADataBinding.DataSource := dsPopulation;  // Assigns a data source
    ADataBinding.DataSource.DataSet := mdPopulation;  // Assigns a dataset
    ADataBinding.DataSource.DataSet.Active := True;  // Enables the assigned dataset
    ADataBinding.ArgumentField.FieldName := 'Year';  // Specifies the source dataset field for arguments
    ADataBinding.ValueField.FieldName := 'Europe';  // Specifies the source dataset field for values
    AXYSeriesEurope.ViewClass := TdxChartXYSeriesLineView;  // Selects the Line series View
    ALineView := AXYSeriesEurope.View as TdxChartXYSeriesLineView;
    ALineView.Markers.Visible := True;  // Displays value markers
    ALineView.ValueLabels.Visible := True;  // Displays value labels
    ALineView.Appearance.StrokeOptions.Width := 2;  // Increases line width
    AXYSeriesAmericas := AXYDiagram.AddSeries;  // Creates a new series with the default settings
    AXYSeriesAmericas.AssignFrom(AXYSeriesEurope);  // Copies all settings from the "Europe" series
    AXYSeriesAmericas.Caption := 'Americas';  // Defines a different series caption
    // Specifies a different source dataset field for values
    ADataBinding := AXYSeriesAmericas.DataBinding as TdxChartXYSeriesDBDataBinding;
    ADataBinding.ValueField.FieldName := 'Americas';
    AXYSeriesAfrica := AXYDiagram.AddSeries;  // Creates a new series with the default settings
    AXYSeriesAfrica.AssignFrom(AXYSeriesEurope);  // Copies all settings from the "Europe" series
    AXYSeriesAfrica.Caption := 'Africa';  // Defines a different series caption
    // Specifies a different source dataset field for values
    ADataBinding := AXYSeriesAfrica.DataBinding as TdxChartXYSeriesDBDataBinding;
    ADataBinding.ValueField.FieldName := 'Africa';
  finally
    dxChartControl1.EndUpdate;  // Calls EndUpdate regardless of the batch operation's success
  end;
end;