TdxChartSeriesCustomDataBinding Class
The base class for all data binding setting classes used by chart series.
Declaration
TdxChartSeriesCustomDataBinding = class(
    TcxOwnedPersistent
)
Remarks
The TdxChartSeriesCustomDataBinding class implements data binding settings common to all data access modes available in the Chart control.
Main API Members
The list below outlines key members of the TdxChartSeriesCustomDataBinding class that allow you to configure data binding settings.
- Refresh
- Repopulates series point data from the underlying dataset.
- Series
- Provides access to the series to which the current data binding settings belong.
- Assign
- Copy data binding settings between series.
Terminal TdxChartSeriesCustomDataBinding Class Descendants
The DataBinding property of a series references a TdxChartSeriesCustomDataBinding object. Cast it to the selected series data binding class to access all data binding type-specific properties and methods. Refer to the following tables for information on the target data binding class depending on the used TdxChartCustomSeries class descendant and the DataBindingType property value:
- TdxChartXYSeries
An XY series uses the following data binding classes depending on the
DataBindingTypeproperty value:DataBindingType[1] Value DataBindingClass[2] Value Description 'DB'[3]TdxChartXYSeriesDBDataBinding An XY chart series connects to a dataset and loads all data records into memory. 'Unbound'TdxChartXYSeriesUnboundDataBinding An XY chart series is not bound to a dataset. You need to populate series with data points manually. - TdxChartSimpleSeries
A simple series uses the following data binding classes depending on the
DataBindingTypeproperty value:DataBindingType[1] Value DataBindingClass[2] Value Description 'DB'[3]TdxChartSimpleSeriesDBDataBinding A simple series connects to a dataset and loads all data records into memory. UnboundTdxChartSimpleSeriesUnboundDataBinding A simple series is not bound to a dataset. You need to populate series with data points manually.
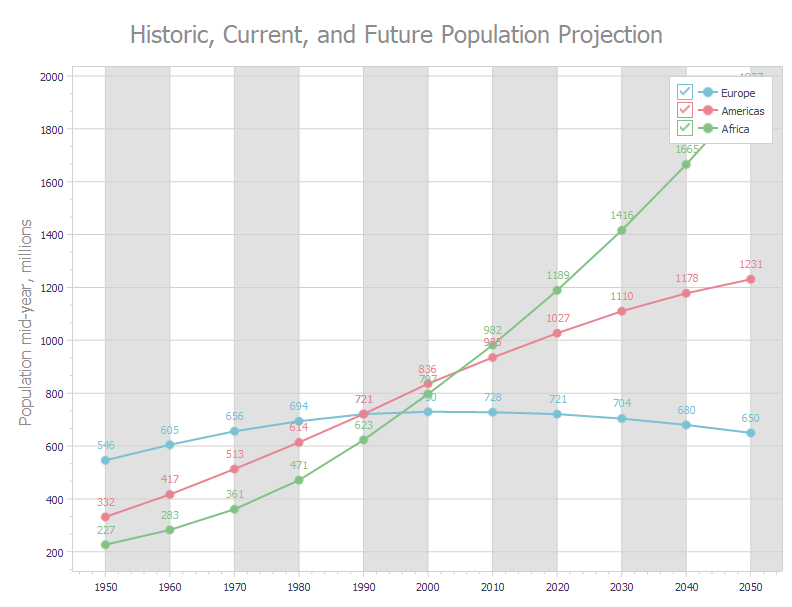
Code Example: Bound Mode
The following code example creates three line series with identical appearance settings in bound mode:
var
  AXYDiagram: TdxChartXYDiagram;
  AXYSeriesAmericas, AXYSeriesEurope, AXYSeriesAfrica: TdxChartXYSeries;
  ALineView: TdxChartXYSeriesLineView;
  ADataBinding: TdxChartXYSeriesDBDataBinding;
begin
  dxChartControl1.BeginUpdate;  // Initiates the following batch change
  try
    dxChartControl1.Titles.Add.Text := 'Historic, Current, and Future Population Projection';
    AXYDiagram := dxChartControl1.AddDiagram<TdxChartXYDiagram>;
    AXYDiagram.Axes.AxisY.Title.Text := 'Population mid-year, millions';
    AXYDiagram.Axes.AxisX.Interlaced := True;
    AXYSeriesEurope := AXYDiagram.AddSeries('Europe');  // Creates a new series with the caption "Europe"
    AXYSeriesEurope.ShowInLegend := TdxChartSeriesShowInLegend.Diagram;
    AXYSeriesEurope.DataBindingClass := TdxChartXYSeriesDBDataBinding;
    ADataBinding := AXYSeriesEurope.DataBinding as TdxChartXYSeriesDBDataBinding;
    ADataBinding.DataSource := dsPopulation;  // Assigns a data source
    ADataBinding.DataSource.DataSet := mdPopulation;  // Assigns a dataset
    ADataBinding.DataSource.DataSet.Active := True;  // Enables the assigned dataset
    ADataBinding.ArgumentField.FieldName := 'Year';  // Specifies the source dataset field for arguments
    ADataBinding.ValueField.FieldName := 'Europe';  // Specifies the source dataset field for values
    AXYSeriesEurope.ViewClass := TdxChartXYSeriesLineView;  // Selects the Line series View
    ALineView := AXYSeriesEurope.View as TdxChartXYSeriesLineView;
    ALineView.Markers.Visible := True;  // Displays value markers
    ALineView.ValueLabels.Visible := True;  // Displays value labels
    ALineView.Appearance.StrokeOptions.Width := 2;  // Increases line width
    AXYSeriesAmericas := AXYDiagram.AddSeries;  // Creates a new series with the default settings
    AXYSeriesAmericas.AssignFrom(AXYSeriesEurope);  // Copies all settings from the "Europe" series
    AXYSeriesAmericas.Caption := 'Americas';  // Defines a different series caption
    // Specifies a different source dataset field for values
    ADataBinding := AXYSeriesAmericas.DataBinding as TdxChartXYSeriesDBDataBinding;
    ADataBinding.ValueField.FieldName := 'Americas';
    AXYSeriesAfrica := AXYDiagram.AddSeries;  // Creates a new series with the default settings
    AXYSeriesAfrica.AssignFrom(AXYSeriesEurope);  // Copies all settings from the "Europe" series
    AXYSeriesAfrica.Caption := 'Africa';  // Defines a different series caption
    // Specifies a different source dataset field for values
    ADataBinding := AXYSeriesAfrica.DataBinding as TdxChartXYSeriesDBDataBinding;
    ADataBinding.ValueField.FieldName := 'Africa';
  finally
    dxChartControl1.EndUpdate;  // Calls EndUpdate regardless of the batch operation's success
  end;
end;
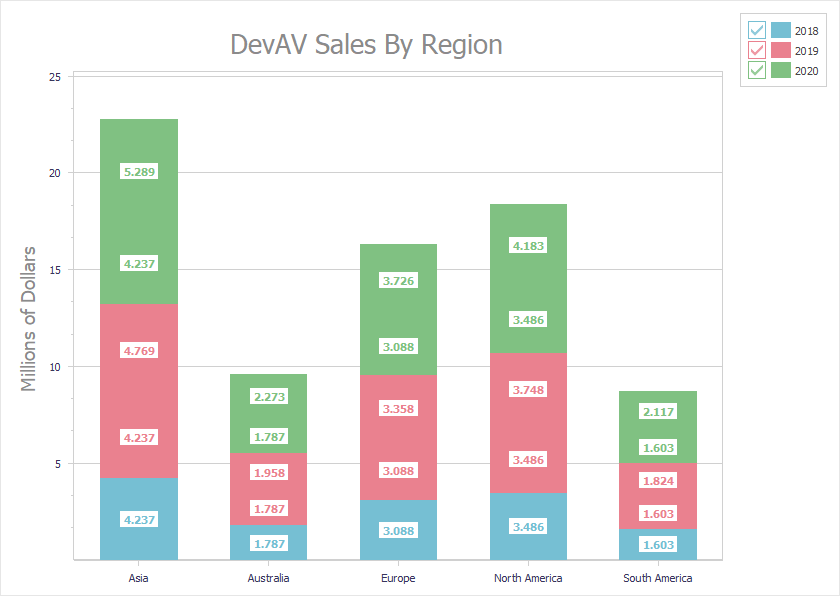
Code Example: Unbound Mode
The following code example creates three stacked bar series with identical appearance settings in unbound data access mode:
uses cxDataStorage;  // Declares the TcxStringValueType class
// ...
var
  AXYDiagram: TdxChartXYDiagram;
  AXY2018Series, AXY2019Series, AXY2020Series: TdxChartXYSeries;
  AStackedBarView: TdxChartXYSeriesStackedBarView;
  ADataBinding: TdxChartXYSeriesUnboundDataBinding;
begin
  dxChartControl1.BeginUpdate;  // Initiates the following batch change
  try
    AXYDiagram := dxChartControl1.AddDiagram<TdxChartXYDiagram>('DevAV Sales By Region');
    AXYDiagram.Title.Appearance.FontOptions.Size := 20;
    AXYDiagram.Axes.AxisY.Title.Text := 'Millions of Dollars';
    AXYDiagram.Axes.AxisY.Title.Appearance.FontOptions.Size := 14;
    AXY2018Series := AXYDiagram.AddSeries('2018');  // Creates a new series with the caption "2018"
    // Selects the unbound data access mode
    AXY2018Series.DataBindingClass := TdxChartXYSeriesUnboundDataBinding;
    ADataBinding := AXY2018Series.DataBinding as TdxChartXYSeriesUnboundDataBinding;
    // Selects the string data type for arguments
    ADataBinding.ArgumentField.ValueTypeClass := TcxStringValueType;
    AXY2018Series.ViewClass := TdxChartXYSeriesStackedBarView;  // Selects the Stacked Bar series View
    AStackedBarView := AXY2018Series.View as TdxChartXYSeriesStackedBarView;
    AStackedBarView.ValueLabels.Visible := True;  // Displays value labels on bars
    AStackedBarView.ValueLabels.TextFormat := '{V:0.000}';  // Changes the number display format
    AStackedBarView.ValueLabels.Appearance.FontOptions.Bold := True;
    AXY2018Series.Points.Add('Asia', 4.2372);
    AXY2018Series.Points.Add('Australia', 1.7871);
    AXY2018Series.Points.Add('Europe', 3.0884);
    AXY2018Series.Points.Add('North America', 3.4855);
    AXY2018Series.Points.Add('South America', 1.6027);
    AXY2019Series := AXYDiagram.AddSeries;  // Creates a new series with the default settings
    AXY2019Series.AssignFrom(AXY2018Series);  // Copies all settings from the "2018" series
    AXY2019Series.Caption := '2019';  // Defines a different series caption
    AXY2019Series.Points.Add('Asia', 4.7685);
    AXY2019Series.Points.Add('Australia', 1.9576);
    AXY2019Series.Points.Add('Europe', 3.3579);
    AXY2019Series.Points.Add('North America', 3.7477);
    AXY2019Series.Points.Add('South America', 1.8237);
    AXY2020Series := AXYDiagram.AddSeries('2020');  // Creates a new series with the default settings
    AXY2020Series.AssignFrom(AXY2018Series);  // Copies all settings from the "2018" series
    AXY2020Series.Caption := '2020';  // Defines a different series caption
    AXY2020Series.Points.Add('Asia', 5.289);
    AXY2020Series.Points.Add('Australia', 2.2727);
    AXY2020Series.Points.Add('Europe', 3.7257);
    AXY2020Series.Points.Add('North America', 4.1825);
    AXY2020Series.Points.Add('South America', 2.1172);
  finally
    dxChartControl1.EndUpdate;  // Calls EndUpdate regardless of the batch operation's success
  end;
end;
Inheritance
-
The DataBindingType property setter updates the DataBindingClass and DataBinding property values according to the selected data access mode.
-
The DataBindingClass property setter updates the DataBindingType and DataBinding property values according to the selected data access mode.
-
The default data access mode.