Radar Series
The Radar series (also called Spider or Star charts) are used to display data as a circular graph. A Radar view is drawn on a circular grid and has multiple axes along which data can be plotted. Note that although these charts normally have a circular shape, they can also be displayed as a polygon.
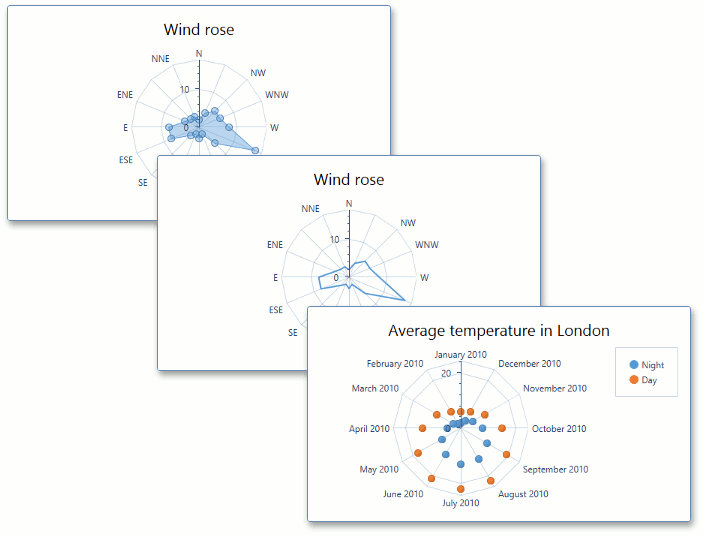
Below is a list of all radar charts, which are currently available.
| |
| |
| |
| |
|


To learn about other series types that can be plotted together with Radar series, see Series Type Compatibility.