Chart Designer for Developers
- 3 minutes to read
The Chart Designer is a tool for building charts of any complexity from scratch and customizing existing charts without using the Visual Studio Properties window.
This topic describes how to invoke the Chart Designer, explains its structure, and provides an example of how use this designer to create a chart.
How to: Invoke the Chart Designer
Invoke the Chart Control’s smart tag menu or Quick Actions. Select the Run Designer link to invoke the designer at design time.
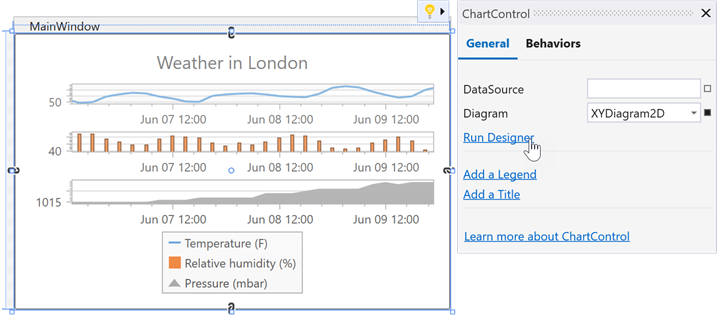
After that, the Chart Designer appears.
You can also invoke the Chart Designer at runtime using the ChartDesigner.Show method:
private void btnRunDesigner_Click(object sender, RoutedEventArgs e) {
    ChartDesigner chartDesigner = new ChartDesigner(chartControl);
    chartDesigner.Show(this, new Theme("Office2016White"), DesignerWindowKind.Bar);
}
Refer to the Chart Designer for End-Users topic for more information.
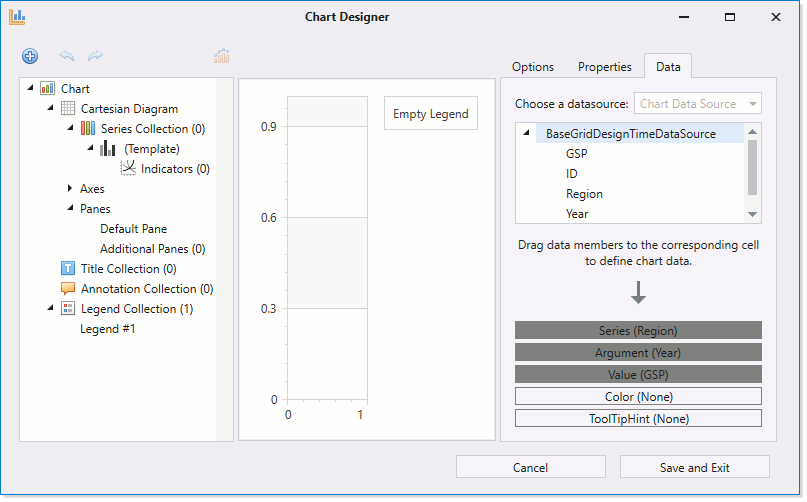
The following image displays the Chart Designer’s main elements:
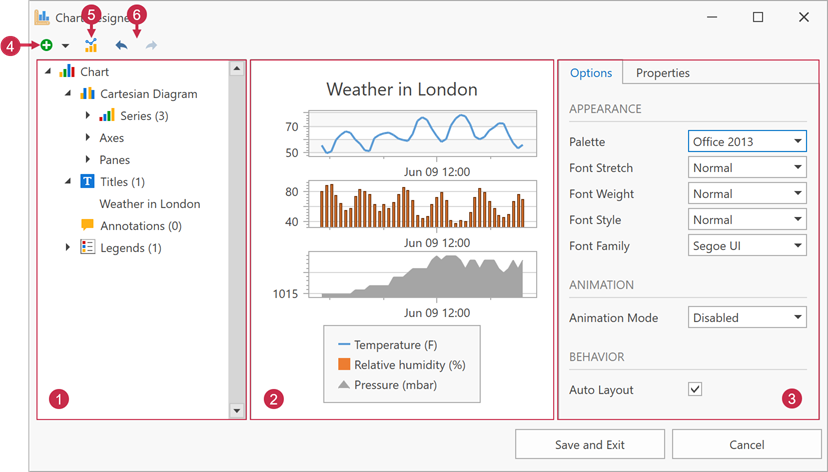
- 1 - Elements Tree
- 2 - Chart Preview
- 3 - Customization Tabs
- 4 - The Add Chart Element button
- 5 - The Change Chart Type button
- 6 - Undo and Redo buttons
Chart Elements Tree
The Chart Elements Tree represents the chart structure and allows you to select chart elements, customize their visibility, and add or remove elements. When you click an element in the tree, it is highlighted in the Chart Preview section, and the Customization Tabs area displays the element’s properties.
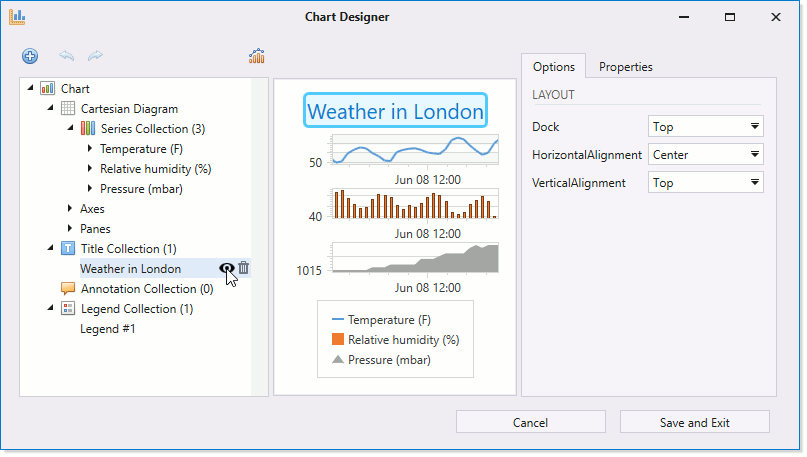
Chart Preview
The Chart Preview area allows you to see how the chart looks. You can click a chart element to show its properties in the Customization Tabsarea.
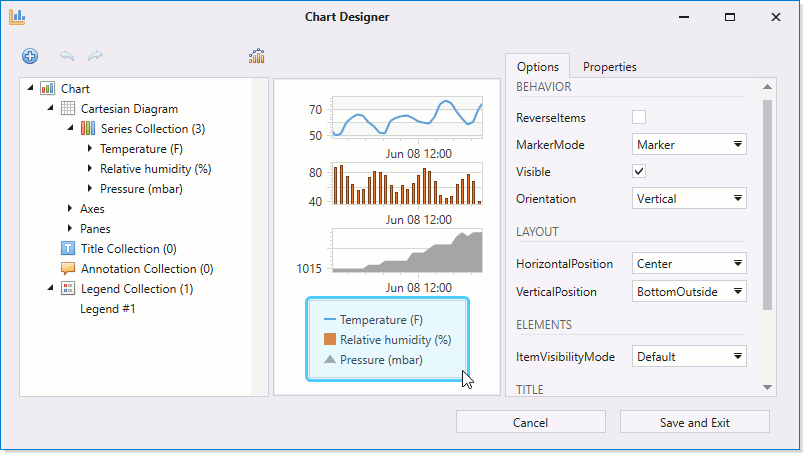
Customization Tabs
The Customization Tabs section comprises tabs that allow you to configure a chart’s settings.
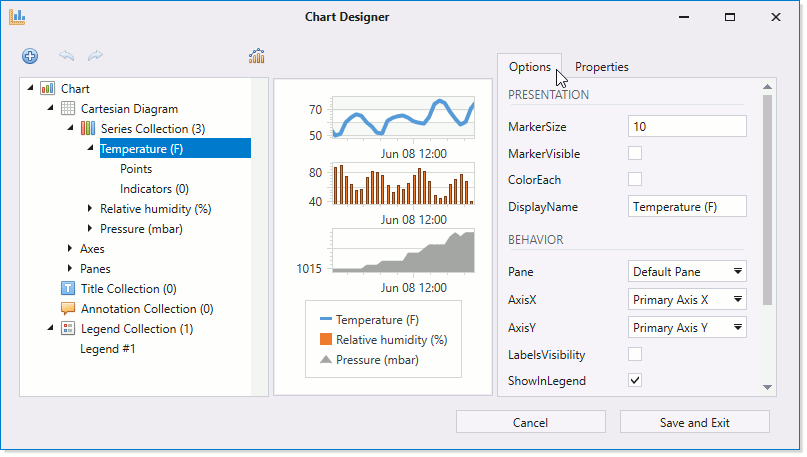
The Options tab contains commonly used element settings.
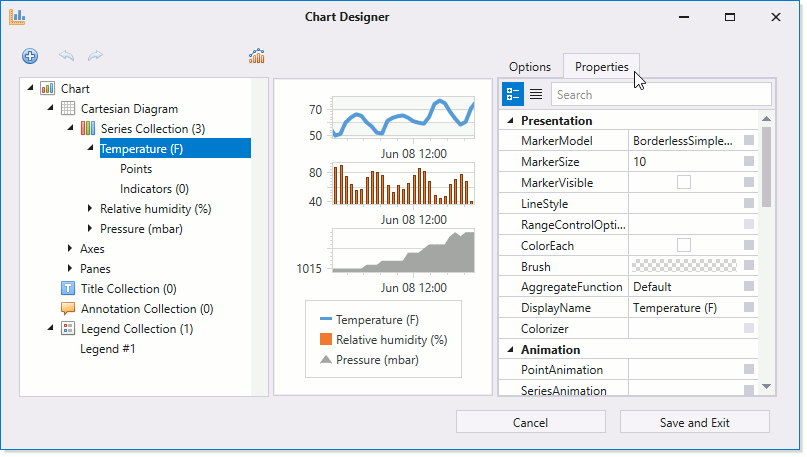
The Properties tab contains all the chart elements’ settings.
The Data section is shown when a series points’ collection is selected in the Elements Tree. In this tab, you can manually edit the points’ collection, for example, remove existing points and add new ones.
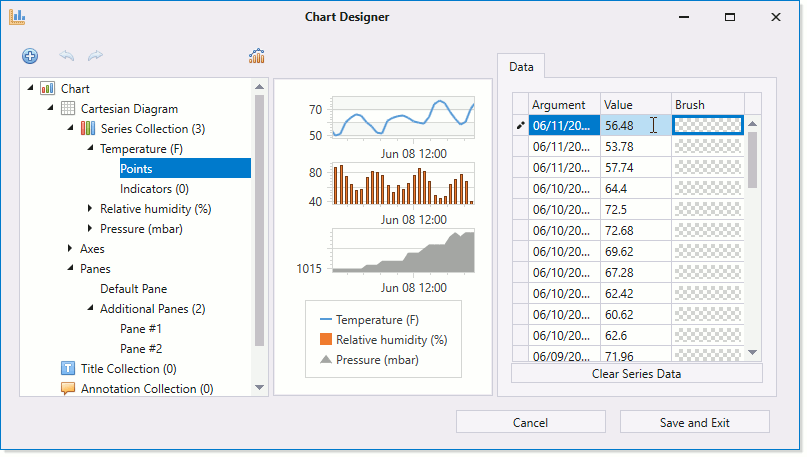
The Data tab is also available when the Chart control is data-bound. In this case, you can specify the data members that define data source fields used to provide data to the chart.
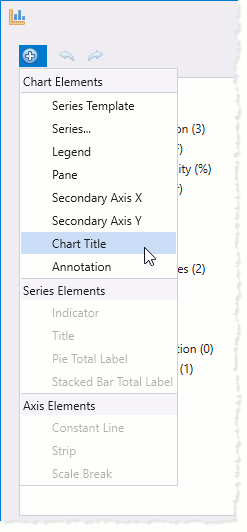
The Add Chart Element Button
You can use the  button to invoke a list of elements that can be added. In the list, select the appropriate item to add the element to the chart, series or axis depending on which element is selected in the Elements Tree.
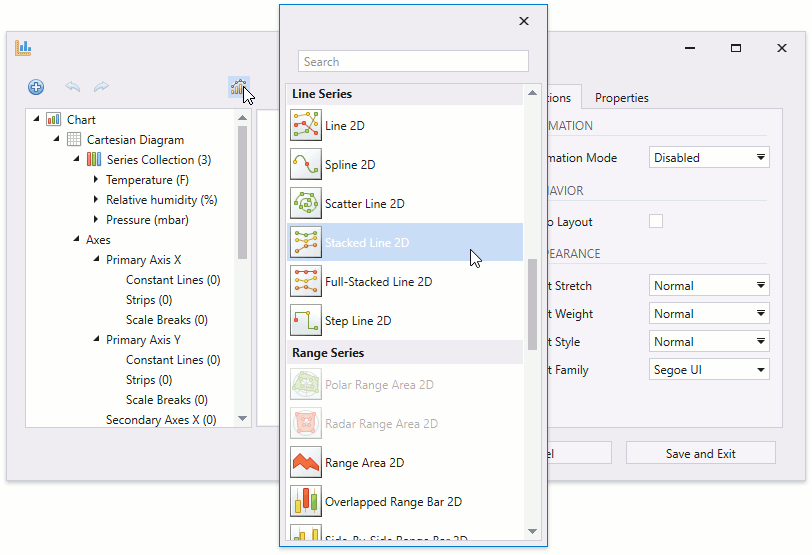
The Change Chart Type Button
Use the  button to invoke an available series types’ list. You can select the required series type to be applied to all series in a chart.
Limitations
If you use Quick Actions to run the Chart Designer, changes made in the Chart Designer can cause the following:
- Markup extensions (except for Binding and DynamicResource) can be removed from the Chart Control’s markup.
- Invalid markup within ChartControl tags can be removed.
Examples
Refer to the Lesson 2 - Create a Chart Using the Designer tutorial for instructions on how to use the designer to create a chart.