
DevExpress v24.2 Update — Your Feedback Matters

Our What's New in v24.2 webpage includes product-specific surveys. Your response to our survey questions will help us measure product satisfaction for features released in this major update and help us refine our plans for our next major release.

Take the survey Not interested

Point, Line, and Bubble Series

The Point, and Line series are used to either show line trends for several series on the same diagram or to show points from different series on the same chart.

PointLineBubbleSeriesExamples

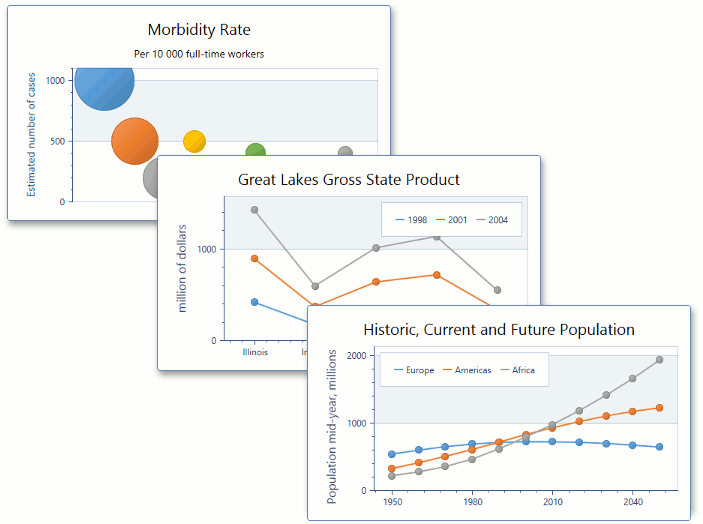
Below is a list of all point, line, and spline charts that are currently available.

PointSeriesIcon

Point

LineSeriesIcon

Line

StackedLineSeriesIcon

Stacked Line

FullStackedLineSeriesIcon

Full-Stacked Line

StepLineSeriesIcon

Step Line

ScatterLineSeriesIcon

Scatter Line

SplineSeriesIcon

Spline

BubbleSeriesIcon

Bubble

To learn about other series types that can be plotted together with the Point, and Lines series, see Series Type Compatibility.