Dashboard.ColorScheme Property
Provides access to a dashboard color scheme.
Namespace: DevExpress.DashboardCommon
Assembly: DevExpress.Dashboard.v26.1.Core.dll
Declaration
Property Value
| Type | Description |
|---|---|
| ColorScheme | A ColorScheme object that is the color scheme used to color dashboard item elements. |
Remarks
The dashboard provides two ways for coloring dashboard item elements:
- Global color scheme
- Provide consistent colors for identical values across the dashboard. To access the dashboard color scheme, use the
ColorSchemeproperty. - Local color scheme
- Provides an individual set of colors for each dashboard item. For instance, the Chart and Pie dashboard items provide the ChartDashboardItemBase.ColorScheme property to access a local color scheme.
The Chart and Pie dashboard items expose the ChartDashboardItemBase.ColoringOptions property. Use this property to access coloring options. (DashboardItemColoringOptions). The DashboardItemColoringOptions.UseGlobalColors property allows you to specify whether the dashboard item uses a global or local color scheme. You can apply specific colors to dimension values/measures, or their combinations.
To color required dimension values/measures, specify the coloring mode using the following properties.
- Dimension.ColoringMode
- Specifies the dimension coloring mode.
- DashboardItemColoringOptions.MeasuresColoringMode
- Specifies the coloring mode for dashboard item measures.
The ColorScheme class provides access to a collection of ColorSchemeEntry objects that allow you to map the required dimension values/measures and the specified color. To do this, use the following members.
- The ColorSchemeEntry.DimensionKeys collection contains ColorSchemeDimensionKey objects that allow you to specify the dimension and corresponding dimension value. Use the Dimension.GetDimensionDefinition method to obtain the dimension definition and pass the returned object to the ColorSchemeDimensionKey constructor.
- The ColorSchemeEntry.MeasureKey property returns the ColorSchemeMeasureKey object that allows you to specify measures to be colored. Use the Measure.GetMeasureDefinition method to obtain the measure definition and pass the returned object to the ColorSchemeMeasureKey constructor.
- The ColorSchemeEntry.DataSource property specifies the data source containing the required dimensions and measures.
- The ColorSchemeEntry.ColorDefinition property allows you to specify the color, hatch style, and line style used to color the dimension values/measures specified above. You can select the required color from a predefined palette or specify a custom color.
Example
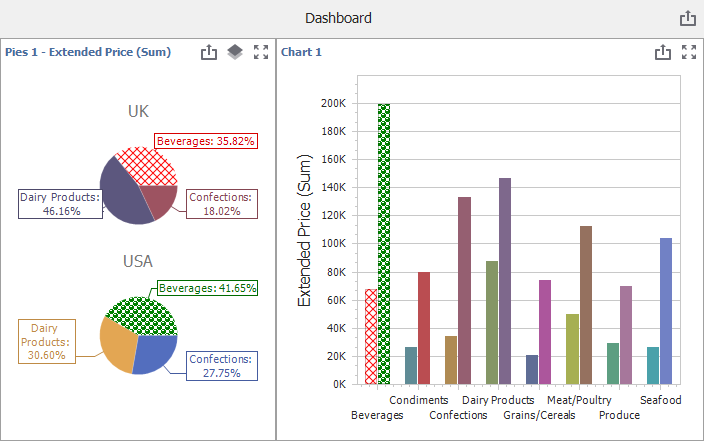
The following example demonstrates how to customize a dashboard color scheme to color specified dimension values using predefined colors.
In this example, the dashboard contains Pie and Chart dashboard items, whose dimension values are colored by hue. Dimension values and corresponding colors are stored in a data table.
To add custom colors to the dashboard color scheme (the Dashboard.ColorScheme property), create the ColorSchemeEntry objects.
The ColorSchemeEntry class has the following properties:
- The ColorSchemeEntry.DataSource property specifies a data source containing dimension values.
- The ColorSchemeEntry.DimensionKeys property allows you to specify the dimension values.
- The ColorSchemeEntry.ColorDefinition property sets the color, fill style, and line style (through a DashboardPaletteItem) used to paint the dimension values.
using DevExpress.DashboardCommon;
using DevExpress.Drawing;
using DevExpress.XtraBars.Ribbon;
using System.Data;
using System.Drawing;

namespace Dashboard_Coloring {
    public partial class Form1 : RibbonForm {
        public Form1() {
            InitializeComponent();
            dashboardDesigner1.CreateRibbon();

            // Create a color table that contains dimension values, measures and colors.
            DataTable colorTable = CreateColorTable();
            // Load a dashboard from the XML file.
            Dashboard dashboard = new Dashboard(); dashboard.LoadFromXml(@"..\..\Data\Dashboard.xml");
            IDashboardDataSource dataSource = dashboard.DataSources["dataSource1"];

            // Specify the coloring mode for the pie series, pie measures and chart argument.
            PieDashboardItem pie1 = (PieDashboardItem)dashboard.Items["pieDashboardItem1"];
            ChartDashboardItem chart1 = (ChartDashboardItem)dashboard.Items["chartDashboardItem1"];
            pie1.SeriesDimensions[0].ColoringMode = ColoringMode.Hue;
            pie1.ColoringOptions.MeasuresColoringMode = ColoringMode.Hue;
            chart1.Arguments[0].ColoringMode = ColoringMode.Hue;

            foreach (DataRow row in colorTable.Rows) {
                dashboard.ColorScheme.Add(CreateColorSchemeEntry(row, dataSource, false));
                dashboard.ColorScheme.Add(CreateColorSchemeEntry(row, dataSource, true));
            }
            dashboardDesigner1.Dashboard = dashboard;
        }

        // Create color scheme entries to map dimension values, measures and colors.
        private ColorSchemeEntry CreateColorSchemeEntry(DataRow colorSchemeRecord,
                                                        IDashboardDataSource dataSource,
                                                        bool includeMeasures) {
            DimensionDefinition categoryDefinition = new DimensionDefinition("CategoryName");
            DimensionDefinition countryDefinition = new DimensionDefinition("Country");
            MeasureDefinition priceDefinition = new MeasureDefinition("Extended Price");

            ColorSchemeEntry entry = new ColorSchemeEntry();
            entry.DimensionKeys.Add(new ColorSchemeDimensionKey(categoryDefinition,
                colorSchemeRecord["CategoryName"]));
            entry.DimensionKeys.Add(new ColorSchemeDimensionKey(countryDefinition,
                colorSchemeRecord["Country"]));
            if (includeMeasures)
                entry.MeasureKey = new ColorSchemeMeasureKey(priceDefinition);
            // Use a DashboardPaletteItem to define the color, a fill style (hatch), and line style.
            entry.ColorDefinition = new ColorDefinition(new DashboardPaletteItem(
                (Color)colorSchemeRecord["color"],
                (DXHatchStyle)colorSchemeRecord["hatch"],
                (DXDashStyle)colorSchemeRecord["line"]));
            entry.DataSource = dataSource;
            return entry;
        }

        private DataTable CreateColorTable() {
            DataTable colorTable = new DataTable();
            colorTable.Columns.Add("CategoryName", typeof(string));
            colorTable.Columns.Add("Country", typeof(string));
            colorTable.Columns.Add("measure", typeof(string));
            colorTable.Columns.Add("color", typeof(Color));
            colorTable.Columns.Add("hatch", typeof(DXHatchStyle));
            colorTable.Columns.Add("line", typeof(DXDashStyle));
            colorTable.Rows.Add("Beverages", "UK", "Extended Price", Color.Red, DXHatchStyle.DiagonalCross, DXDashStyle.Dash);
            colorTable.Rows.Add("Beverages", "USA", "Extended Price", Color.Green, DXHatchStyle.Sphere, DXDashStyle.Dot);
            return colorTable;
        }
    }
}
The image below shows the resulting dashboard with the customized color scheme: