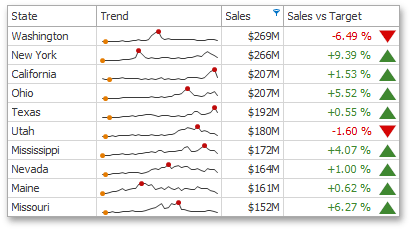
GridDashboardItem Class
A Grid dashboard item that visualizes data in tabular form.
Namespace: DevExpress.DashboardCommon
Assembly: DevExpress.Dashboard.v25.2.Core.dll
NuGet Package: DevExpress.Dashboard.Core
Declaration
Remarks
The Grid shows data in tabular form while allowing you to summarize against specific measures or calculate differences between them.

The following documentation is available.
Example
The following example demonstrates how to create Grid columns and bind a Grid dashboard item to data in code.
As a result, you get the Grid dashboard item with columns created at runtime.
using DevExpress.DashboardCommon;
using DevExpress.DataAccess.Excel;
using DevExpress.XtraEditors;
using System;

namespace Dashboard_CreateGrid {
    public partial class Form1 : XtraForm {
        public Form1() {
            InitializeComponent();

        }
        private void Form1_Load(object sender, EventArgs e) {

            // Creates the Excel data source.
            DashboardExcelDataSource excelDataSource = new DashboardExcelDataSource();
            excelDataSource = CreateExcelDataSource();

            // Creates the Grid dashboard item and adds it to a dashboard.
            Dashboard dashboard1 = new Dashboard();
            dashboard1.DataSources.Add(excelDataSource);
            GridDashboardItem grid = CreateGrid(excelDataSource);
            dashboard1.Items.Add(grid);
            dashboardViewer1.Dashboard = dashboard1;

            // Reloads data in the data sources.
            dashboardViewer1.ReloadData();
        }
        private GridDashboardItem CreateGrid(DashboardExcelDataSource dataSource) {

            // Creates a grid dashboard item and specifies its data source.
            GridDashboardItem grid = new GridDashboardItem();
            grid.DataSource = dataSource;

            // Creates new grid columns of the specified type and with the specified dimension or
            // measure. Then, adds these columns to the grid's Columns collection.
            grid.Columns.Add(new GridHyperlinkColumn(new Dimension("Product"), "Product")
                {UriPattern= "https://www.google.com/search?q={0}" });
            grid.Columns.Add(new GridDimensionColumn(new Dimension("Category")));
            grid.Columns.Add(new GridMeasureColumn(new Measure("Count")));
            grid.Columns.Add(new GridDeltaColumn(new Measure("Count"),
                                                 new Measure("TargetCount")));
            grid.Columns.Add(new GridSparklineColumn(new Measure("Count")));
            grid.SparklineArgument = new Dimension("Date", DateTimeGroupInterval.MonthYear);

            grid.GridOptions.EnableBandedRows = true;
            grid.GridOptions.ShowHorizontalLines = false;

            return grid;
        }

        public DashboardExcelDataSource CreateExcelDataSource() {

            // Generates the Excel Data Source.
            DashboardExcelDataSource excelDataSource = new DashboardExcelDataSource();
            excelDataSource.FileName = @"Data\SimpleDataSource.xls";
            ExcelWorksheetSettings worksheetSettings = new ExcelWorksheetSettings("Simple Data", "A1:F12");
            excelDataSource.SourceOptions = new ExcelSourceOptions(worksheetSettings);
            excelDataSource.Fill();

            return excelDataSource;
        }
    }
}
Implements
Inheritance
Object
DashboardItem
DataDashboardItem
GridDashboardItem
See Also