ChartDashboardItem Class
A Chart dashboard item that visualizes data in an XY-diagram.
Namespace: DevExpress.DashboardCommon
Assembly: DevExpress.Dashboard.v25.2.Core.dll
NuGet Package: DevExpress.Dashboard.Core
Declaration
public class ChartDashboardItem :
    ChartDashboardItemBase,
    IChartAxisContainer,
    IFormatOwnerContext,
IChartModelRemarks
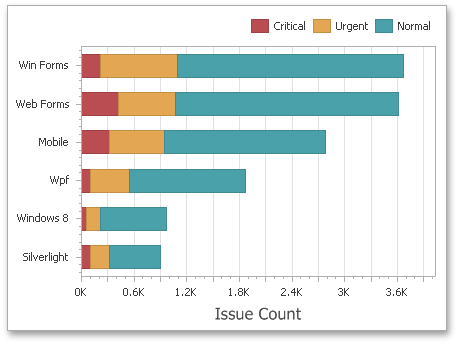
The chart dashboard item visualizes data in an XY-diagram, allowing you to render a wide range of diagram types - from simple bar or line charts to financial Open-High-Low-Close graphs.

The following documentation is available.
Example
The following example binds a Chart dashboard item to data in code.
using DevExpress.DashboardCommon;
using DevExpress.XtraEditors;
using System;

namespace Dashboard_CreateChart {
    public partial class Form1 : XtraForm {
        public Form1() {
            InitializeComponent();
        }
        private ChartDashboardItem CreateChart(DashboardObjectDataSource dataSource) {
            // Creates a chart dashboard item and specifies its data source.
            ChartDashboardItem chart = new ChartDashboardItem();
            chart.DataSource = dataSource;

            // Specifies the dimension used to provide data for arguments on a chart.
            chart.Arguments.Add(new Dimension("Sales Person", DateTimeGroupInterval.Year));

            // Specifies the dimension that provides data for chart series.
            chart.SeriesDimensions.Add(new Dimension("OrderDate"));

            // Adds a new chart pane to the chart's Panes collection.
            chart.Panes.Add(new ChartPane());
            // Creates a new series of the Bar type.
            SimpleSeries salesAmountSeries = new SimpleSeries(SimpleSeriesType.Bar);
            // Specifies the measure that provides data used to calculate
            // the Y-coordinate of data points.
            salesAmountSeries.Value = new Measure("Extended Price");
            // Adds created series to the pane's Series collection to display within this pane.
            chart.Panes[0].Series.Add(salesAmountSeries);

            chart.Panes.Add(new ChartPane());
            SimpleSeries taxesAmountSeries = new SimpleSeries(SimpleSeriesType.StackedBar);
            taxesAmountSeries.Value = new Measure("Quantity");
            chart.Panes[1].Series.Add(taxesAmountSeries);

            return chart;
        }
        private void Form1_Load(object sender, EventArgs e) {
            // Creates a dashboard and sets it as the currently opened dashboard in the dashboard viewer.
            dashboardViewer1.Dashboard = new Dashboard();

            // Creates a data source and adds it to the dashboard data source collection.
            DashboardObjectDataSource dataSource = new DashboardObjectDataSource();
            dataSource.DataSource = (new nwindDataSetTableAdapters.SalesPersonTableAdapter()).GetData();
            dashboardViewer1.Dashboard.DataSources.Add(dataSource);

            // Creates a chart dashboard item with the specified data source
            // and adds it to the Items collection to display within the dashboard.
            ChartDashboardItem chart = CreateChart(dataSource);
            dashboardViewer1.Dashboard.Items.Add(chart);

            // Reloads data in the data sources.
            dashboardViewer1.ReloadData();
        }
    }
}
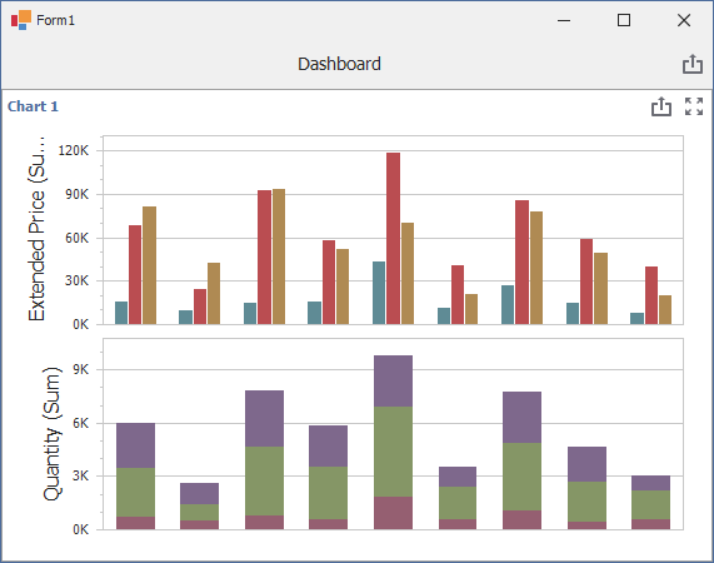
The image below shows the resulting Chart dashboard item:

Implements
Inheritance
See Also