ComboBoxDashboardItem Class
A Combo Box dashboard item that allows end-users to filter other dashboard items.
Namespace: DevExpress.DashboardCommon
Assembly: DevExpress.Dashboard.v26.1.Core.dll
Declaration
Remarks
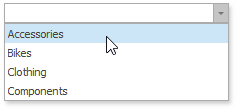
The Combo Box dashboard item provides the capability to filter other dashboard items and allows end-users to select a value(s) from the drop-down list .
The following documentation is available.
Example
This example demonstrates how to combine filter elements in a group and bind them to data in code.
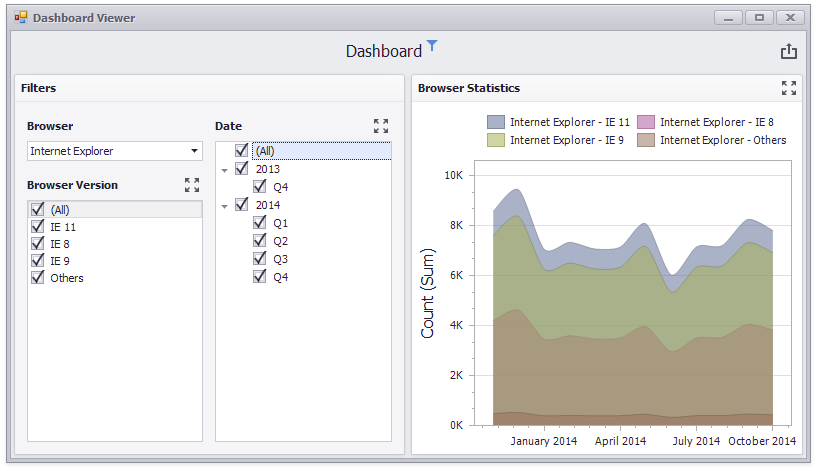
The dashboard contains the following filter items combined in a group:
ComboBoxDashboardItem- ListBoxDashboardItem
- TreeViewDashboardItem
The group serve as a master filter for the Chart dashboard item.
using DevExpress.DashboardCommon;
using DevExpress.DataAccess.ConnectionParameters;
using DevExpress.DataAccess.Sql;
using DevExpress.XtraEditors;
using System;

namespace Dashboard_FilterElements_and_Groups {
    public partial class Form1 : XtraForm {
        public Form1() {
            InitializeComponent();
        }

        private void Form1_Load(object sender, EventArgs e) {
            DashboardSqlDataSource dataSource = CreateDataSource();
            dashboardViewer1.Dashboard = CreateDashboard(dataSource);
            dashboardViewer1.SetMasterFilter("comboBoxDashboardItem1", "Internet Explorer");
        }

        private static DashboardSqlDataSource CreateDataSource() {
            DashboardSqlDataSource dataSource = new DashboardSqlDataSource();
            dataSource.ConnectionParameters =
                new XmlFileConnectionParameters(@"..\..\Data\WebsiteStatisticsData.xml");
            SelectQuery selectQuery = SelectQueryFluentBuilder
                .AddTable("Data")
                .SelectColumns("Browser", "BrowserDetails", "Date", "Count")
                .Build("Statistics");
            dataSource.Queries.Add(selectQuery);
            return dataSource;
        }

        private static Dashboard CreateDashboard(DashboardSqlDataSource dataSource) {
            Dashboard dashboard1 = new Dashboard();
            dashboard1.DataSources.Add(dataSource);

            ComboBoxDashboardItem comboBox1 = new ComboBoxDashboardItem() {
                Name = "Browser",
                DataSource = dataSource,
                DataMember = "Statistics",
                ComboBoxType = ComboBoxDashboardItemType.Checked
            };
            comboBox1.FilterDimensions.Add(new Dimension("Browser"));

            ListBoxDashboardItem listBox1 = new ListBoxDashboardItem() {
                Name = "Browser Version",
                DataSource = dataSource,
                DataMember = "Statistics"
            };
            listBox1.FilterDimensions.Add(new Dimension("BrowserDetails"));
            listBox1.InteractivityOptions.IgnoreMasterFilters = false;

            TreeViewDashboardItem treeView1 = new TreeViewDashboardItem() {
                Name = "Date",
                DataSource = dataSource,
                DataMember = "Statistics",
                AutoExpandNodes = true
            };
            treeView1.FilterDimensions.AddRange(new Dimension("Date", DateTimeGroupInterval.Year),
                new Dimension("Date", DateTimeGroupInterval.Quarter));

            DashboardItemGroup group1 = new DashboardItemGroup() {
                Name = "Filters"
            };
            group1.InteractivityOptions.IsMasterFilter = true;
            dashboard1.Groups.Add(group1);
            group1.AddRange(comboBox1, treeView1, listBox1);

            ChartDashboardItem chart1 = new ChartDashboardItem() {
                Name = "Browser Statistics",
                DataSource = dataSource,
                DataMember = "Statistics",
            };
            chart1.Arguments.Add(new Dimension("Date", DateTimeGroupInterval.MonthYear));
            chart1.SeriesDimensions.AddRange(new Dimension("Browser"), new Dimension("BrowserDetails"));
            chart1.Panes.Add(new ChartPane());
            SimpleSeries salesAmountSeries = new SimpleSeries(SimpleSeriesType.SplineArea);
            salesAmountSeries.Value = new Measure("Count");
            chart1.Panes[0].Series.Add(salesAmountSeries);
            dashboard1.Items.Add(chart1);

            return dashboard1;
        }
    }
}
Implements
Inheritance
Object
DashboardItem
DataDashboardItem
FilterElementDashboardItem
ComboBoxDashboardItem
See Also