ChoroplethMapDashboardItem Class
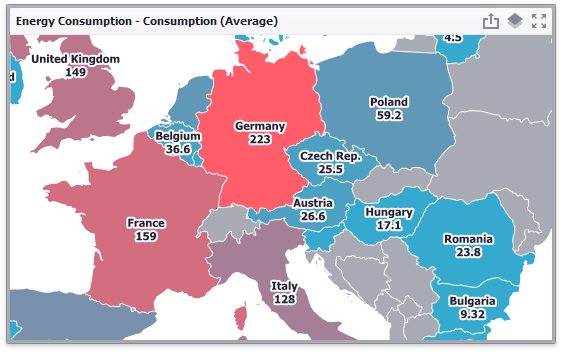
A Choropleth Map dashboard item that colors areas depending on the provided values.
Namespace: DevExpress.DashboardCommon
Assembly: DevExpress.Dashboard.v25.2.Core.dll
NuGet Package: DevExpress.Dashboard.Core
Declaration
Remarks
The Choropleth Map dashboard item allows you to colorize required areas in proportion to the provided values. For instance, you can visualize a sales amount or population density.

The following documentation is available.
Example
The following code snippet demonstrates how to bind a Choropleth Map dashboard item to data in code.
using System.Windows.Forms;
using DevExpress.DashboardCommon;
using DevExpress.DataAccess.ConnectionParameters;
using DevExpress.DataAccess.Sql;

namespace Dashboard_CreateChoroplethMap {
    public partial class Form1 : DevExpress.XtraEditors.XtraForm
    {
        public Form1() {
            InitializeComponent();

            Dashboard dashboard = new Dashboard();

            DashboardSqlDataSource dataSource = new DashboardSqlDataSource();
            CustomSqlQuery sqlQuery = new CustomSqlQuery("Countries", "select * from Countries");
            dataSource.ConnectionParameters = new Access97ConnectionParameters(@"..\..\Data\countriesDB.mdb", "", "");
            dataSource.Queries.Add(sqlQuery);

            ChoroplethMapDashboardItem choroplethMap = new ChoroplethMapDashboardItem();
            choroplethMap.DataSource = dataSource;
            choroplethMap.DataMember = "Countries";

            choroplethMap.Area = ShapefileArea.WorldCountries;

            choroplethMap.AttributeName = "NAME";
            choroplethMap.AttributeDimension = new Dimension("Country");

            ValueMap populationMap = new ValueMap(new Measure("Population"));
            choroplethMap.Maps.Add(populationMap);

            dashboard.Items.Add(choroplethMap);
            dashboardViewer1.Dashboard = dashboard;
        }
    }
}
Implements
Inheritance
Object
DashboardItem
DataDashboardItem
MapDashboardItem
ChoroplethMapDashboardItem
See Also