SecondaryAxisXCollection.Add(SecondaryAxisX) Method
Appends the specified SecondaryAxisX object to the current collection.
Namespace: DevExpress.XtraCharts
Assembly: DevExpress.XtraCharts.v26.1.dll
Declaration
Parameters
| Name | Type | Description |
|---|---|---|
| axis | SecondaryAxisX | A SecondaryAxisX object to append to the collection. |
Returns
| Type | Description |
|---|---|
| Int32 | An integer value indicating the position into which a new element was inserted. |
Remarks
This method adds a SecondaryAxisX object to the end of the collection.
For more information, refer to Primary and Secondary Axes.
Example
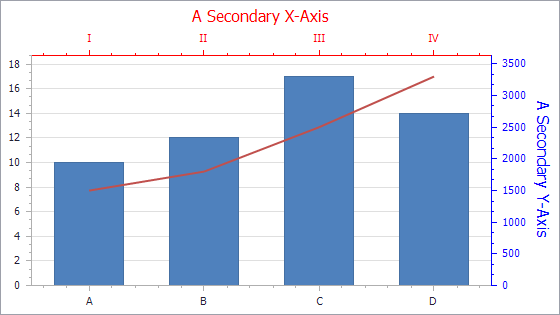
This example demonstrates how to add secondary axes to a chart at runtime.
Use the following API members to add secondary axes:
| Member | Description |
|---|---|
| XYDiagram2D.SecondaryAxesX | Gets the collection of secondary X-axes. |
| SecondaryAxisX | Represents the secondary X-axis within a chart control in 2D series, except for the Swift Plot and Swift Point. |
| XYDiagram2D.SecondaryAxesY | Gets the collection of secondary Y-axes. |
| SecondaryAxisY | Represents the secondary Y-axis within a chart control in 2D series, except for the Swift Plot and Swift Point. |
using System;
using System.Drawing;
using System.Windows.Forms;
using DevExpress.XtraCharts;
// ...

private void Form1_Load(object sender, EventArgs e) {
    // Create a new chart.
    ChartControl chartControl1 = new ChartControl();

    // Create two series.
    Series series1 = new Series("Series 1", ViewType.Bar);
    Series series2 = new Series("Series 2", ViewType.Line);

    // Add points to them, with their arguments different.
    series1.Points.Add(new SeriesPoint("A", 10));
    series1.Points.Add(new SeriesPoint("B", 12));
    series1.Points.Add(new SeriesPoint("C", 17));
    series1.Points.Add(new SeriesPoint("D", 14));
    series2.Points.Add(new SeriesPoint("I", 1500));
    series2.Points.Add(new SeriesPoint("II", 1800));
    series2.Points.Add(new SeriesPoint("III", 2500));
    series2.Points.Add(new SeriesPoint("IV", 3300));

    // Add both series to the chart.
    chartControl1.Series.AddRange(new Series[] { series1, series2 });

    // Hide the legend (optional).
    chartControl1.Legend.Visibility = DevExpress.Utils.DefaultBoolean.False;

    // Create two secondary axes, and add them to the chart's Diagram.
    SecondaryAxisX myAxisX = new SecondaryAxisX("my X-Axis");
    SecondaryAxisY myAxisY = new SecondaryAxisY("my Y-Axis");

    ((XYDiagram)chartControl1.Diagram).SecondaryAxesX.Add(myAxisX);
    ((XYDiagram)chartControl1.Diagram).SecondaryAxesY.Add(myAxisY);

    // Assign the series2 to the created axes.
    ((LineSeriesView)series2.View).AxisX = myAxisX;
    ((LineSeriesView)series2.View).AxisY = myAxisY;

    // Customize the appearance of the secondary axes (optional).
    myAxisX.Title.Text = "A Secondary X-Axis";
    myAxisX.Title.Visibility = DevExpress.Utils.DefaultBoolean.True;
    myAxisX.Title.TextColor = Color.Red;
    myAxisX.Label.TextColor = Color.Red;
    myAxisX.Color = Color.Red;

    myAxisY.Title.Text = "A Secondary Y-Axis";
    myAxisY.Title.Visibility = DevExpress.Utils.DefaultBoolean.True;
    myAxisY.Title.TextColor = Color.Blue;
    myAxisY.Label.TextColor = Color.Blue;
    myAxisY.Color = Color.Blue;

    // Add the chart to the form.
    chartControl1.Dock = DockStyle.Fill;
    this.Controls.Add(chartControl1);
}
Related GitHub Examples
The following code snippet (auto-collected from DevExpress Examples) contains a reference to the Add(SecondaryAxisX) method.
Note
The algorithm used to collect these code examples remains a work in progress. Accordingly, the links and snippets below may produce inaccurate results. If you encounter an issue with code examples below, please use the feedback form on this page to report the issue.