RangeSegmentColorizer.RangeStops Property
Returns the collection of double values that form ranges to determine the color a line segment should have.
Namespace: DevExpress.XtraCharts
Assembly: DevExpress.XtraCharts.v25.2.dll
NuGet Package: DevExpress.Charts
Declaration
Property Value
| Type | Description |
|---|---|
| DoubleCollection | The collection that contains range stops. |
Example
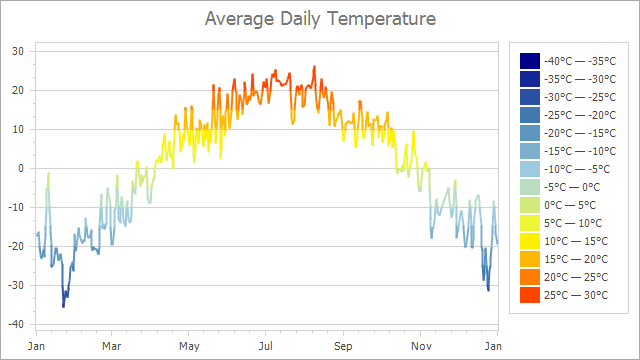
This example demonstrates how to use the RangeSegmentColorizer to color a line series by its segments.

Follow the steps below to configure the RangeSegmentColorizer object and apply it to a line series view:
Create a RangeSegmentColorizer instance and assign it to the LineSeriesView.SegmentColorizer property.
Populate the
RangeSegmentColorizer.RangeStopscollection.Use the RangeSegmentColorizer.Palette property to define a palette.
The RangeSegmentColorizer.LegendItemPattern property allows you to specify how to format text the legend shows for each color range.
RangeSegmentColorizer colorizer = new RangeSegmentColorizer();
colorizer.RangeStops.AddRange(new double[] { -40, -35, -30, -25, -20, -15, -10, -5, 0, 5, 10, 15, 20, 25, 30 });
colorizer.Palette = new Palette("TemperaturePalette", new PaletteEntry[] { new PaletteEntry(Color.DarkBlue),
                                                                           new PaletteEntry(Color.SteelBlue),
                                                                           new PaletteEntry(Color.LightBlue),
                                                                           new PaletteEntry(Color.Yellow),
                                                                           new PaletteEntry(Color.OrangeRed) });
// Alternatively, you can use PaletteName to specify a palette.
// colorizer.PaletteName = Palettes.Slipstream.DisplayName;
colorizer.ShowInLegend = true;
colorizer.LegendItemPattern = "{V1:F0}°C — {V2:F0}°C";
LineSeriesView lineSeriesView = chartControl.Series[0].View as LineSeriesView;
lineSeriesView.SegmentColorizer = colorizer;