RangeSegmentColorizer.Palette Property
Gets or sets the palette that provides colors for the colorizer.
Namespace: DevExpress.XtraCharts
Assembly: DevExpress.XtraCharts.v25.2.dll
NuGet Package: DevExpress.Charts
Declaration
Property Value
| Type | Description |
|---|---|
| Palette | The colorizer palette. |
Remarks
If the Palette (PaletteName) property is not specified, the colorizer uses the Chart Control’s palette (see the ChartControl.PaletteName property).
Example
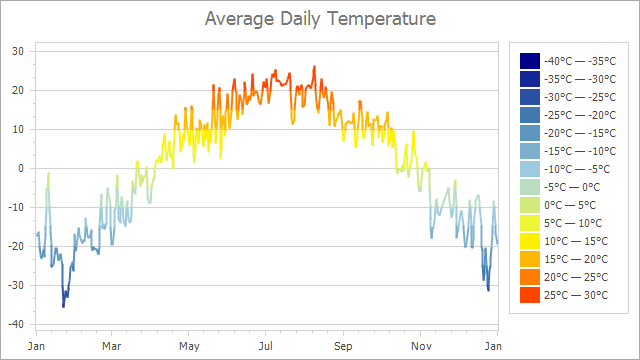
This example demonstrates how to use the RangeSegmentColorizer to color a line series by its segments.

Follow the steps below to configure the RangeSegmentColorizer object and apply it to a line series view:
Create a RangeSegmentColorizer instance and assign it to the LineSeriesView.SegmentColorizer property.
Populate the RangeSegmentColorizer.RangeStops collection.
Use the
RangeSegmentColorizer.Paletteproperty to define a palette.The RangeSegmentColorizer.LegendItemPattern property allows you to specify how to format text the legend shows for each color range.
RangeSegmentColorizer colorizer = new RangeSegmentColorizer();
colorizer.RangeStops.AddRange(new double[] { -40, -35, -30, -25, -20, -15, -10, -5, 0, 5, 10, 15, 20, 25, 30 });
colorizer.Palette = new Palette("TemperaturePalette", new PaletteEntry[] { new PaletteEntry(Color.DarkBlue),
                                                                           new PaletteEntry(Color.SteelBlue),
                                                                           new PaletteEntry(Color.LightBlue),
                                                                           new PaletteEntry(Color.Yellow),
                                                                           new PaletteEntry(Color.OrangeRed) });
// Alternatively, you can use PaletteName to specify a palette.
// colorizer.PaletteName = Palettes.Slipstream.DisplayName;
colorizer.ShowInLegend = true;
colorizer.LegendItemPattern = "{V1:F0}°C — {V2:F0}°C";
LineSeriesView lineSeriesView = chartControl.Series[0].View as LineSeriesView;
lineSeriesView.SegmentColorizer = colorizer;