PieSeriesLabel.Position Property
Gets or sets the position of labels relative to each other and the pie diagram.
Namespace: DevExpress.XtraCharts
Assembly: DevExpress.XtraCharts.v26.1.dll
Declaration
[XtraChartsLocalizableCategory(XtraChartsCategory.Behavior)]
public PieSeriesLabelPosition Position { get; set; }Property Value
| Type | Description |
|---|---|
| PieSeriesLabelPosition | An PieSeriesLabelPosition enumeration value which specifies the position of labels relative to each other and to the pie diagram. |
Available values:
| Name | Description |
|---|---|
| Inside | Specifies that point labels should be painted directly on the corresponding slice of a Pie chart.
|
| Outside | Specifies that point labels should be painted outside a Pie chart, near the corresponding slice.
|
| TwoColumns | Specifies that point labels should be painted outside a Pie chart and organized into two columns on the left and right of the Pie chart.
|
| Radial | Specifies that point labels should be painted radially on the corresponding slices of a Pie chart.
|
| Tangent | Specifies that point labels should be painted tangentially on the corresponding slices of a Pie chart.
|


Remarks
Refer to the PieSeriesLabelPosition enumeration’s description for a list of the available label positions.
Example
The following example shows how to create a Pie chart at runtime.
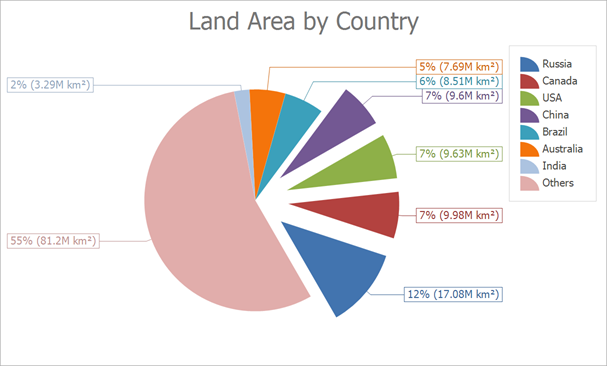
The Chart Control uses the Simple Diagram to display pies. Cast the ChartControl.Diagram property to the SimpleDiagram type to access diagram settings. The Chart Control determines the diagram type based on the series that is added first. We recommend that you access the diagram to configure its settings after at least one series is added to the chart.
To access pie series view settings, cast the SeriesBase.View property to the PieSeriesView type.
using System;
using System.Collections.Generic;
using System.Windows.Forms;
using DevExpress.XtraCharts;

namespace Series_PieChart {
    public partial class Form1 : DevExpress.XtraEditors.XtraForm {
        public Form1() {
            InitializeComponent();
        }
        private void Form1_Load(object sender, EventArgs e) {
            // Create an empty chart.
            ChartControl pieChart = new ChartControl();

            pieChart.Titles.Add(new ChartTitle() { Text = "Land Area by Country" });

            // Create a pie series.
            Series series1 = new Series("Land Area by Country", ViewType.Pie);

            // Bind the series to data.
            series1.DataSource = DataPoint.GetDataPoints();
            series1.ArgumentDataMember = "Argument";
            series1.ValueDataMembers.AddRange(new string[] { "Value" });

            // Add the series to the chart.
            pieChart.Series.Add(series1);

            // Access diagram settings.
            SimpleDiagram diagram = (SimpleDiagram)pieChart.Diagram;
            diagram.Margins.All = 10;

            // Format the the series labels.
            series1.Label.TextPattern = "{VP:p0} ({V:.##}M km²)";

            // Format the series legend items.
            series1.LegendTextPattern = "{A}";

            // Adjust the position of series labels.
            ((PieSeriesLabel)series1.Label).Position = PieSeriesLabelPosition.TwoColumns;

            // Detect overlapping of series labels.
            ((PieSeriesLabel)series1.Label).ResolveOverlappingMode = ResolveOverlappingMode.Default;

            // Access the view-type-specific options of the series.
            PieSeriesView myView = (PieSeriesView)series1.View;

            // Specify the pie rotation.
            myView.Rotation = -60;

            // Specify a data filter to explode points.
            myView.ExplodedPointsFilters.Add(new SeriesPointFilter(SeriesPointKey.Value_1,
                DataFilterCondition.GreaterThanOrEqual, 9));
            myView.ExplodedPointsFilters.Add(new SeriesPointFilter(SeriesPointKey.Argument,
                DataFilterCondition.NotEqual, "Others"));
            myView.ExplodeMode = PieExplodeMode.UseFilters;
            myView.ExplodedDistancePercentage = 30;
            myView.RuntimeExploding = true;

            // Customize the legend.
            pieChart.Legend.Visibility = DevExpress.Utils.DefaultBoolean.True;

            // Add the chart to the form.
            pieChart.Dock = DockStyle.Fill;
            this.Controls.Add(pieChart);
        }
    }
    public class DataPoint {
        public string Argument { get; set; }
        public double Value { get; set; }

        public static List<DataPoint> GetDataPoints() {
            return new List<DataPoint> {
                    new DataPoint { Argument = "Russia",    Value = 17.0752},
                    new DataPoint { Argument = "Canada",    Value = 9.98467},
                    new DataPoint { Argument = "USA",       Value = 9.63142},
                    new DataPoint { Argument = "China",     Value = 9.59696},
                    new DataPoint { Argument = "Brazil",    Value = 8.511965},
                    new DataPoint { Argument = "Australia", Value = 7.68685},
                    new DataPoint { Argument = "India",     Value = 3.28759},
                    new DataPoint { Argument = "Others",    Value = 81.2}
                };
        }
    }
}
Related GitHub Examples
The following code snippet (auto-collected from DevExpress Examples) contains a reference to the Position property.
Note
The algorithm used to collect these code examples remains a work in progress. Accordingly, the links and snippets below may produce inaccurate results. If you encounter an issue with code examples below, please use the feedback form on this page to report the issue.