Legend Class
Represents a chart’s legend.
Namespace: DevExpress.XtraCharts
Assembly: DevExpress.XtraCharts.v25.2.dll
NuGet Package: DevExpress.Charts
Declaration
Remarks
The Legend class contains the settings that define the legend functionality within a chart control. An object of the Legend type can be accessed using a chart control’s ChartControl.Legend and ChartControl.Legendsproperties.
The legend identifies different chart elements (such as series, constant lines and strips). An element is represented in the legend when its ShowInLegend property is enabled (in particular, the SeriesBase.ShowInLegend, ConstantLine.ShowInLegend and Strip.ShowInLegend properties).
The following properties allow you to control legend options:
- The legend’s title options (LegendBase.Title).
- The custom legend items (LegendBase.CustomItems) and their visibility mode (LegendBase.ItemVisibilityMode).
- The legend’s horizontal and vertical alignment within the chart control (LegendBase.AlignmentHorizontal and LegendBase.AlignmentVertical).
- The appearance settings of the legend’s area (LegendBase.BackColor, LegendBase.BackImage, Legend.Border, LegendBase.FillStyle and LegendBase.Shadow).
- The appearance settings of the legend’s contents (LegendBase.EnableAntialiasing, LegendBase.Font and LegendBase.TextColor).
- The positioning of the legend’s entries (LegendBase.Direction, LegendBase.EquallySpacedItems, LegendBase.HorizontalIndent, LegendBase.VerticalIndent and LegendBase.TextOffset).
- The legend marker settings (LegendBase.MarkerSize and Legend.MarkerVisible).
- The legend’s visibility (LegendBase.Visibility).
For more information, refer to Legends.
Example
This example demonstrates how to access a chart’s Legend and customize its appearance at runtime.
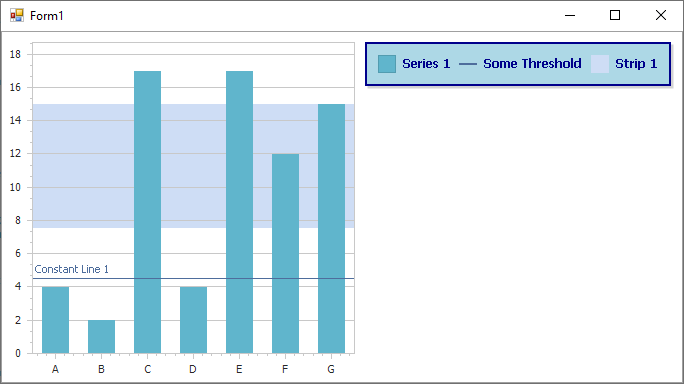
To specify whether series, indicators, Constant Lines, and Strips should be shown in the legend, set their SeriesBase.ShowInLegend, Indicator.ShowInLegend, ConstantLine.ShowInLegend, and Strip.ShowInLegend properties to true.
using System;
using System.Drawing;
using System.Windows.Forms;
using DevExpress.Drawing;
using DevExpress.XtraCharts;

namespace ChartLegend {
    public partial class Form1 : Form {
        public Form1() {
            InitializeComponent();
        }
        private void Form1_Load(object sender, EventArgs e) {
            // Create an empty chart.
            ChartControl chartControl1 = new ChartControl();

            // Create a series and add points to it.
            Series series1 = new Series("Series 1", ViewType.Bar);
            series1.Points.Add(new SeriesPoint("A", new double[] { 4 }));
            series1.Points.Add(new SeriesPoint("B", new double[] { 2 }));
            series1.Points.Add(new SeriesPoint("C", new double[] { 17 }));
            series1.Points.Add(new SeriesPoint("D", new double[] { 4 }));
            series1.Points.Add(new SeriesPoint("E", new double[] { 17 }));
            series1.Points.Add(new SeriesPoint("F", new double[] { 12 }));
            series1.Points.Add(new SeriesPoint("G", new double[] { 15 }));

            // Add the series to the chart.
            chartControl1.Series.Add(series1);

            // Create a constant line (optional).
            ConstantLine constantLine1 = new ConstantLine("Constant Line 1");
            ((XYDiagram)chartControl1.Diagram).AxisY.ConstantLines.Add(constantLine1);
            constantLine1.AxisValue = 4.5;

            // Create a strip (optional).
            Strip strip1 = new Strip("Strip 1");
            ((XYDiagram)chartControl1.Diagram).AxisY.Strips.Add(strip1);
            strip1.MaxLimit.AxisValue = 15;
            strip1.MinLimit.AxisValue = 7.5;

            // Customize the strip's and constant line's legend appearance.
            strip1.ShowInLegend = true;
            constantLine1.ShowInLegend = true;
            constantLine1.LegendText = "Some Threshold";

            // Display the chart control's legend.
            chartControl1.Legend.Visibility = DevExpress.Utils.DefaultBoolean.True;

            // Define its horizontal and vertical alignment.
            chartControl1.Legend.AlignmentHorizontal = LegendAlignmentHorizontal.RightOutside;
            chartControl1.Legend.AlignmentVertical = LegendAlignmentVertical.Top;

            // Define the layout of items within the legend.
            chartControl1.Legend.Direction = LegendDirection.LeftToRight;
            chartControl1.Legend.EquallySpacedItems = true;
            chartControl1.Legend.HorizontalIndent = 4;
            chartControl1.Legend.VerticalIndent = 4;
            chartControl1.Legend.TextOffset = 4;

            // Define the limits for the legend to occupy the chart's space.
            chartControl1.Legend.MaxHorizontalPercentage = 50;
            chartControl1.Legend.MaxVerticalPercentage = 50;

            // Define the legend markers' options.
            chartControl1.Legend.MarkerVisible = true;
            chartControl1.Legend.MarkerSize = new Size(20, 20);

            // Customize the legend appearance.
            chartControl1.Legend.BackColor = Color.LightBlue;
            chartControl1.Legend.FillStyle.FillMode = FillMode.Empty;

            chartControl1.Legend.Border.Color = Color.DarkBlue;
            chartControl1.Legend.Border.Thickness = 2;
            chartControl1.Legend.Border.Visibility = DevExpress.Utils.DefaultBoolean.True;

            chartControl1.Legend.Shadow.Visible = true;
            chartControl1.Legend.Shadow.Color = Color.LightGray;
            chartControl1.Legend.Shadow.Size = 2;

            // Customize the legend text properties.
            chartControl1.Legend.EnableAntialiasing = DevExpress.Utils.DefaultBoolean.False;
            chartControl1.Legend.DXFont = new DXFont("Tahoma", 9, DXFontStyle.Bold);
            chartControl1.Legend.TextColor = Color.DarkBlue;

            // Add the chart to the form.
            chartControl1.Dock = DockStyle.Fill;
            this.Controls.Add(chartControl1);
        }
    }
}