Strips
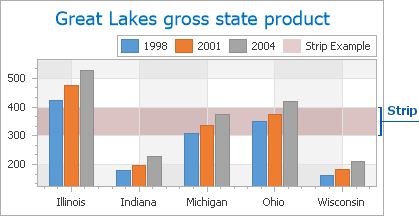
Strips are the highlighted areas in a chart’s diagram within the defined range of values (minimum and maximum) of an axis, to which they belong. In general, strips are used to visually represent a range of values behind series, to trace whether the series points’ values fall in or out of that range. End-users can quickly and easily identify data that falls within a given range when strip lines are implemented. For more detailed information, refer to Strips.
The table below lists the main properties which affect the element’s appearance and functionality:
Availability | The Axis2D.Strips property of an axis, the StripCollection.Item property of the axis’s strip line collection. |
Appearance | |
Identification | Strip.AxisLabelText, ChartElementNamed.Name, Strip.LegendText |
Position | |
Behavior | |
Visibility | |
Custom Draw Event |