ChartRangeControlClientGridOptions.SnapOffset Property
Gets or sets the snap offset in the viewport area of the range control.
Namespace: DevExpress.XtraCharts
Assembly: DevExpress.XtraCharts.v23.2.dll
NuGet Package: DevExpress.Charts
Declaration
Property Value
| Type | Description |
|---|---|
| Double | A Double value which specifies the snap offset. |
Remarks
Use the SnapOffset property if you wish the offset to be taken into account when snapping the selection thumbs to the range interval in the viewport of the range control.
Note
The SnapOffset property is set to 0 by default.
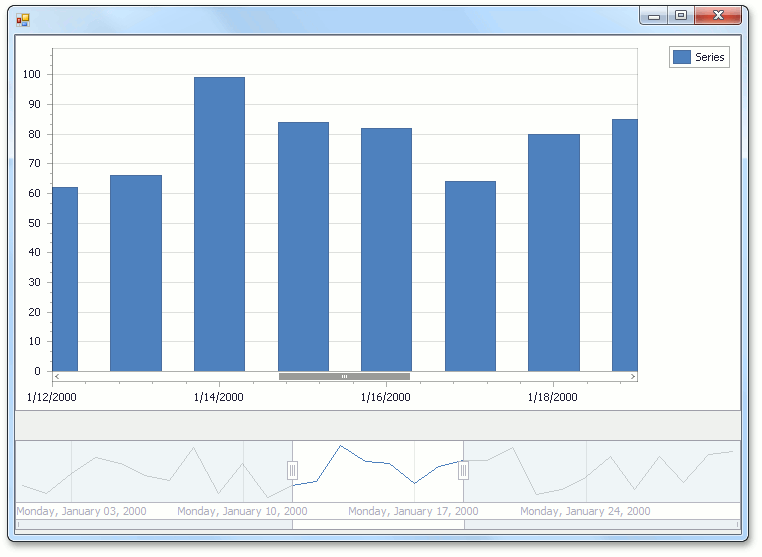
For example, the image below shows the selected range from 1/12/2000 to 1/19/2000 in the range control. As you can see, the first day in the range is Wednesday, not Monday, because the SnapOffset property is set to 2. So, the first two days of the week are skipped.
Example
This example demonstrates how the grid lines and grid snapping of the chart within the range control’s viewport can be customized at runtime.
To access the client options of the chart inside the range control’s viewport, use the RangeControl.ClientOptions property. In this example, the chart control contains data with date-time arguments, so this property returns an object of the ChartRangeControlClientDateTimeOptions type.
To access the grid properties (e.g., ChartRangeControlClientGridOptions.SnapSpacing, ChartRangeControlClientDateTimeGridOptions.SnapAlignment, ChartRangeControlClientGridOptions.GridSpacing and ChartRangeControlClientDateTimeGridOptions.GridAlignment) of the chart range control client, access the ChartRangeControlClientDateTimeGridOptions object using the ChartRangeControlClientDateTimeOptions.RangeControlDateTimeGridOptions property.
using System;
using System.Windows.Forms;
using DevExpress.XtraCharts;

namespace DateTimeChartRangeControlClient {
    public partial class Form1 : Form {

        const int daysForYear = 30;

        public Form1() {
            InitializeComponent();

            // Call the InitializeChart method.
            InitializeChart();

            // Specify a Chart control as the Range control client.
            rangeControl1.Client = chartControl1;

            // Access the date-time grid options of the chart range control client.
            var clientOptions = (ChartRangeControlClientDateTimeOptions)rangeControl1.ClientOptions;
            ChartRangeControlClientDateTimeGridOptions gridOptions = clientOptions.RangeControlDateTimeGridOptions;

            // Specify the manual grid mode of the chart range control client.
            gridOptions.GridMode = ChartRangeControlClientGridMode.Manual;

            // Customize snap and grid properties of the chart range control client.
            gridOptions.SnapOffset = 2;
            gridOptions.SnapSpacing = 7;
            gridOptions.SnapAlignment = DateTimeGridAlignment.Day;
            gridOptions.GridSpacing = 7;
            gridOptions.GridAlignment = DateTimeGridAlignment.Day;
            gridOptions.GridOffset = 1;

            // Format labels of the chart range control client.
            gridOptions.LabelFormat = "D";
        }

        void InitializeChart() {

            DateTime baseDate = new DateTime(2000, 1, 1);
            Random rnd = new Random();
            Series series = new Series("Series", ViewType.Bar);

            for (int dayCount = 0; dayCount < daysForYear; dayCount++) {
                DateTime argument = baseDate.AddDays(dayCount);
                double value = rnd.Next(50, 100);
                var seriesPoint = new SeriesPoint(argument, value);
                series.Points.Add(seriesPoint);
            }
            chartControl1.Series.Add(series);
        }
    }
}