Lesson 5 - Display Summaries
- 2 minutes to read
This tutorial demonstrates how to display summaries for groups of rows (group summary) or individual data columns (total summary). The tutorial is based on Lesson 4.
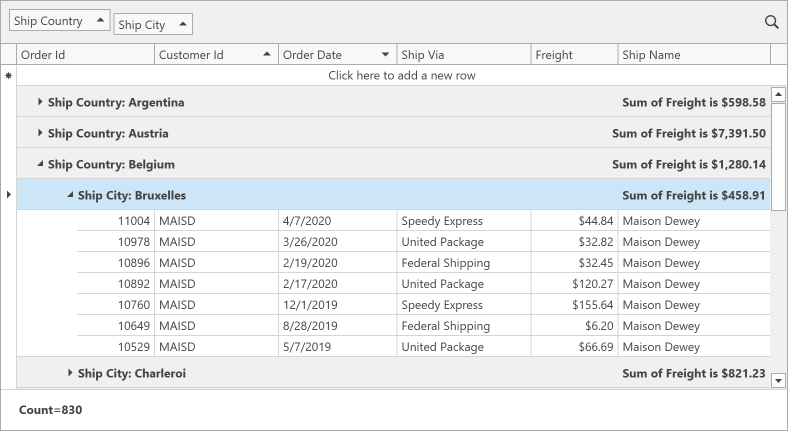
The GridControl can calculate the following summaries:
- The number of data rows (Count)
- The maximum and minimum values (Max and Min)
- The sum and the average value (Sum and Average)
- Custom summaries
Total Summary
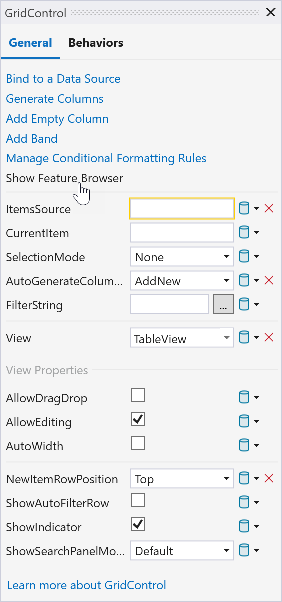
- Select the GridControl and invoke its Quick Actions menu.
Click the Show Feature Browser button:
In the Feature Browser window, go to Data Shaping → Total Summaries.
Click the GridControl and ensure that the DataViewBase.ShowFixedTotalSummary property is set to
true. This property displays the Fixed Summary Panel.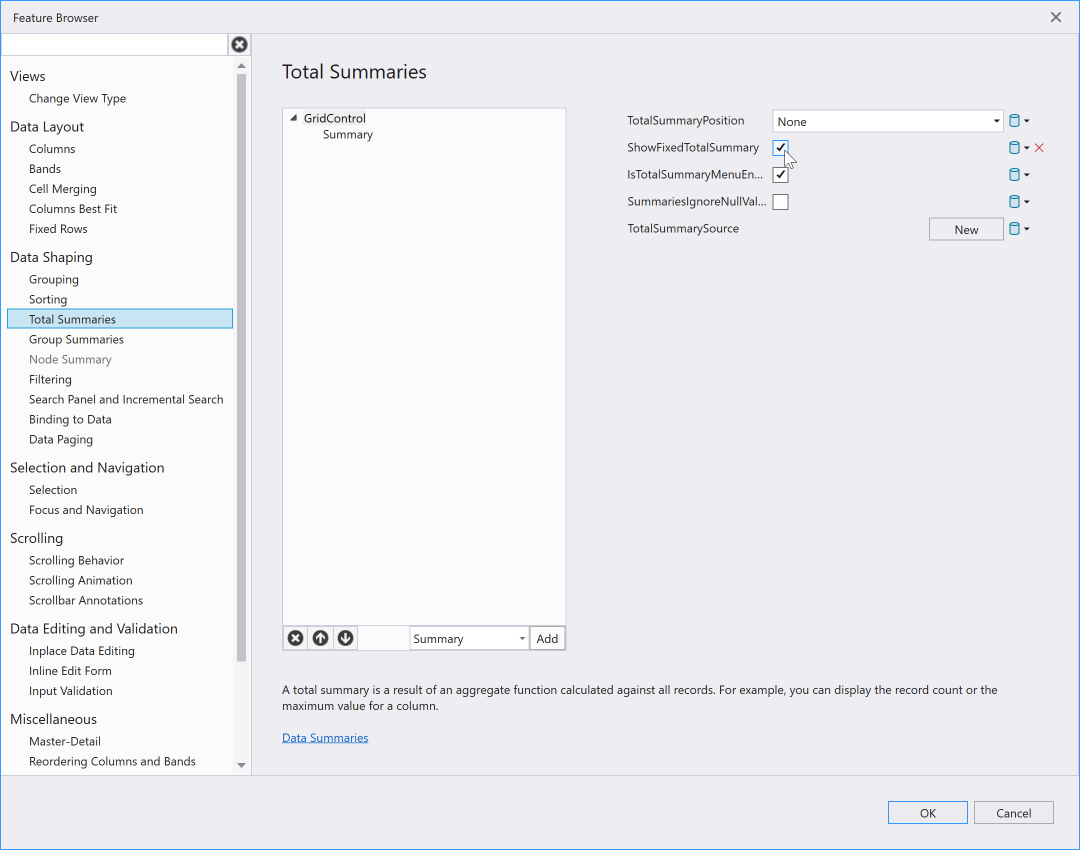
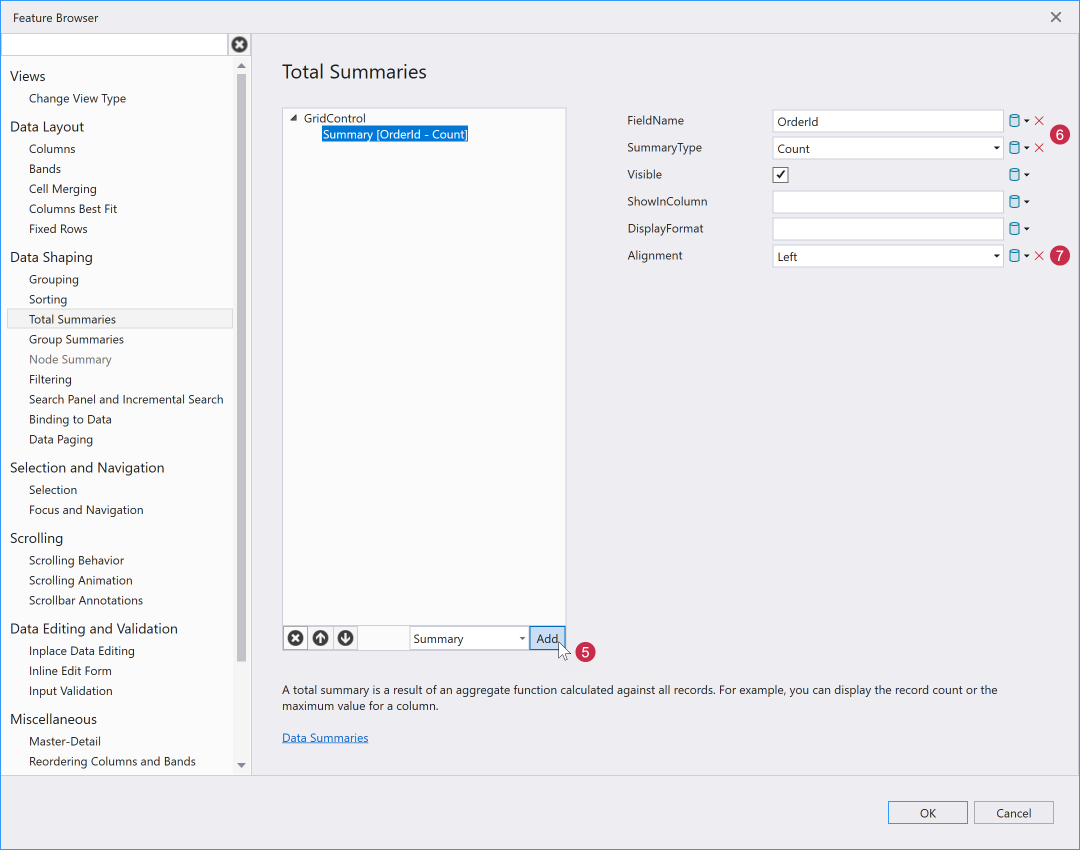
Click the Add button to create a GridSummaryItem object and assign it to the GridControl.TotalSummary collection.
- Specify the FieldName and SummaryType properties to apply the summary.
- Set the Alignment property to Left to display the summary on the left side of the Fixed Summary Panel.
Group Summary
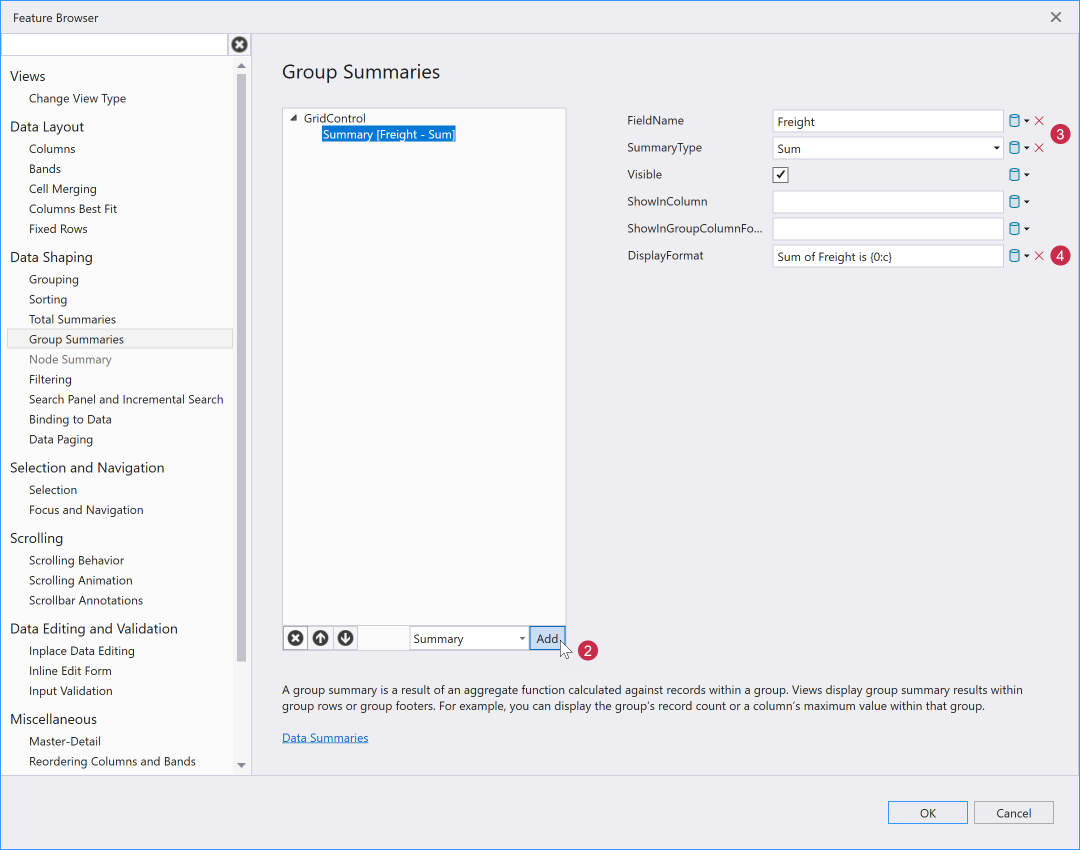
- Open the Feature Browser window and go to Data Shaping → Group Summaries.
- Click the Add button to create a GridSummaryItem object and assign it to the GridControl.GroupSummary collection.
- Specify the FieldName and SummaryType properties to apply the summary.
- Specify the DisplayFormat property to display the group summary in the currency format.
Refer to the following help topic for information on how users can create and customize summaries: Edit Summaries.
See Also