Scatter Line
Short Description
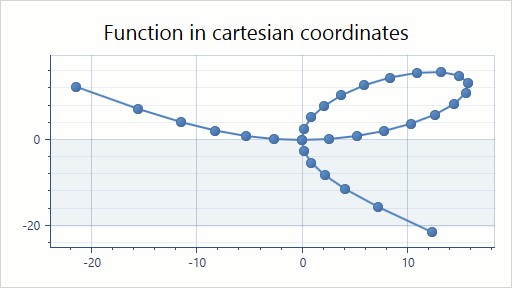
The Scatter Line series displays series points in the same order they were added to the collection (opposite to the Line series that automatically sorts all series points within the collection by their arguments). This chart type can be used in scientific work for displaying and comparing numeric values, such as scientific, statistical and engineering data.
An example of the Scatter Line chart is shown in the image below.
Series Characteristics
The table below lists the main characteristics of this chart type.
| Feature | Value |
|---|---|
| Series View type | LineScatterSeries2D |
| Diagram type | XYDiagram2D |
| Number of arguments per series point | 1 |
| Number of values per series point | 1 |
Note
- For information on which series view types can be combined with the Scatter Line view, refer to the Series Type Compatibility document.
- This series view type is displayed correctly only if scale types of the X and Y axes are numeric continuous. For more information, refer to the ContinuousNumericScaleOptions document.
Examples
The following examples demonstrate how to create a 2D Scatter Line chart.