TdxChartSimpleToolTipOptions.ShowForSeries Property
Specifies if the Chart control displays a tooltip for a series.
Declaration
property ShowForSeries: Boolean read; write; default False;Property Value
| Type | Default | Description |
|---|---|---|
| Boolean | False |
|
Remarks
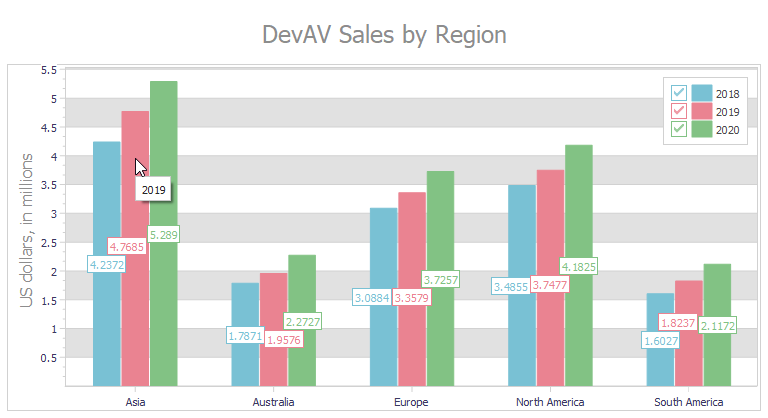
A series tooltip displays a series caption.
Use ShowForSeries and ShowForPoints properties to enable or disable tooltips for series and their points. To apply custom formatting patterns to series and series point tooltips, use SeriesToolTipFormat and PointToolTipFormat properties of the target series.
XY Series: Line and Area Views
You can set ShowForSeries and ShowForPoints properties to False or True to independently disable or enable tooltips for XY series and their points when a Line or Area View is active.
| ShowForSeries Value | Example[1] |
|---|---|
False (default) |
 |
True |
 |
All Simple Series and Bar XY Series
For a simple series or an XY series with any Bar View active, you can display a series tooltip only when series point tooltips are disabled (the ShowForPoints property is set to False).
| ShowForSeries Value | Example[2] |
|---|---|
False (default) |
 |
True |
 |
Default Value
The ShowForSeries property’s default value is False.
-
This example demonstrates different
ShowForSeriesproperty values on the same XY series with the active Line View. -
This example demonstrates different
ShowForSeriesproperty values on the same simple series with the active Doughnut View.