TdxCustomChartControl.AddDiagram(TdxChartDiagramClass,string) Method
Declaration
function AddDiagram(ADiagramClass: TdxChartDiagramClass; const ACaption: string = ''): TdxChartCustomDiagram; overload;Parameters
| Name | Type | Description |
|---|---|---|
| ADiagramClass | TdxChartDiagramClass | Specifies the type of the created diagram. Pass a reference to a TdxChartCustomDiagram class descendant to create a diagram of the corresponding type. |
| ACaption | string | Optional. Specifies the created diagram’s title. |
Returns
| Type | Description |
|---|---|
| TdxChartCustomDiagram | The created diagram. Cast the returned object to the TdxChartXYDiagram or TdxChartSimpleDiagram class depending on the actual diagram type ( |
Remarks
Call the AddDiagram function to create diagrams of any supported type. Pass a reference to one of the following diagram classes as the ADiagramClass parameter to create a diagram of the corresponding type:
- TdxChartXYDiagram
A diagram designed to display series using the axis of arguments (X-axis) and the axis of values (Y-axis). An XY diagram can plot Area, Bar, and Line series.
- TdxChartSimpleDiagram
A diagram intended to plot Pie and Doughnut series.
You can use the Diagrams or VisibleDiagrams property to access all created diagrams by their indexes.
Code Example: Create an XY Diagram
The following code example creates an XY diagram with two Bar chart series and populates them with data in unbound mode:
var
  AXYDiagram: TdxChartXYDiagram;
  AXYSeries: TdxChartXYSeries;
begin
  dxChartControl1.BeginUpdate;  // Initiates the following batch change
  try
    AXYDiagram := dxChartControl1.AddDiagram(TdxChartXYDiagram, 'DevAV Sales by Region');
    AXYDiagram.Title.Appearance.FontOptions.Size := 20;
    AXYDiagram.Axes.AxisY.Title.Text := 'Millions of Dollars';
    AXYSeries := AXYDiagram.AddSeries('2018');  // Creates a new XY series with the caption "2018"
    AXYSeries.DataBindingType := 'Unbound';  // Selects the unbound data access mode
    TdxChartXYSeriesUnboundDataBinding(AXYSeries.DataBinding).ArgumentField.ValueType := 'string';
    AXYSeries.ViewType := 'Bar';  // Selects the Bar series View
    AXYSeries.Points.Add('Asia', 4.2372);
    AXYSeries.Points.Add('Australia', 1.7871);
    AXYSeries.Points.Add('Europe', 3.0884);
    AXYSeries.Points.Add('North America', 3.4855);
    AXYSeries.Points.Add('South America', 1.6027);
    AXYSeries.View.ValueLabels.Visible := True;  // Displays value labels on bars
    AXYSeries := AXYDiagram.AddSeries('2019');  // Creates a new XY series with the caption "2019"
    AXYSeries.DataBindingType := 'Unbound';  // Selects the unbound data access mode
    TdxChartXYSeriesUnboundDataBinding(AXYSeries.DataBinding).ArgumentField.ValueType := 'string';
    AXYSeries.ViewType := 'Bar';  // Selects the Bar series View
    AXYSeries.Points.Add('Asia', 4.7685);
    AXYSeries.Points.Add('Australia', 1.9576);
    AXYSeries.Points.Add('Europe', 3.3579);
    AXYSeries.Points.Add('North America', 3.7477);
    AXYSeries.Points.Add('South America', 1.8237);
    AXYSeries.View.ValueLabels.Visible := True;  // Displays value labels on bars
  finally
    dxChartControl1.EndUpdate;  // Calls EndUpdate regardless of the batch operation's success
  end;
end;
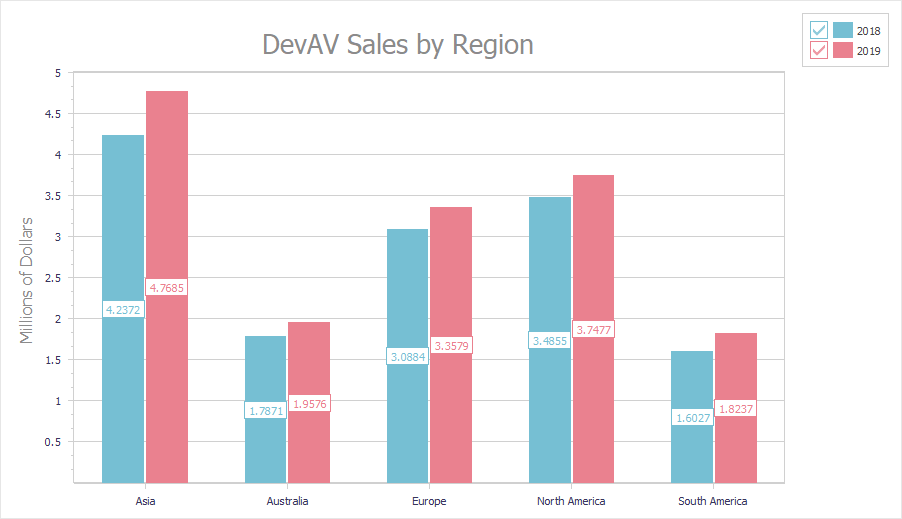
Diagram Deletion
To delete a diagram, release it directly in code (call the Free procedure in Delphi or use the delete keyword in C++Builder).