
NumericScaleOptions.IntervalOptions Property
Stores options for numeric axis when its ScaleMode is Interval.
Namespace: DevExpress.XtraCharts
Assembly: DevExpress.XtraCharts.v26.1.dll
NuGet Package: DevExpress.Charts
Declaration
Property Value
| Type | Description |
|---|---|
| NumericIntervalOptions | The numeric axis’s interval settings. |
Property Paths
You can access this nested property as listed below:
| Object Type | Path to IntervalOptions |
|---|---|
| AxisBase |
|
Example
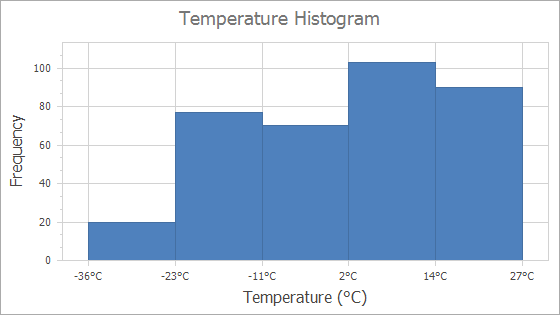
This example demonstrates how to create a histogram chart with a given number of bins.
private void Form1_Load(object sender, EventArgs e) {
    // Load data to a chart.
    chartControl1.DataSource = LoadDataTableFromXml("..\\..\\Data\\CityWeather.xml", "CityWeather");
    Series series = new Series();
    series.ArgumentDataMember = "Temperature";
    SideBySideBarSeriesView view = series.View as SideBySideBarSeriesView;
    view.Border.Visibility = DevExpress.Utils.DefaultBoolean.True;
    view.BarWidth = 1;
    chartControl1.Series.Add(series);
    // Configure histogram options.
    XYDiagram diagram = chartControl1.Diagram as XYDiagram;
    NumericScaleOptions scaleOptions = diagram.AxisX.NumericScaleOptions;
    scaleOptions.AggregateFunction = AggregateFunction.Histogram;
    scaleOptions.ScaleMode = ScaleMode.Interval;
    scaleOptions.IntervalOptions.DivisionMode = IntervalDivisionMode.Count;
    scaleOptions.IntervalOptions.Count = 5;
    scaleOptions.IntervalOptions.GridLayoutMode = GridLayoutMode.GridAndLabelShifted;
    diagram.AxisX.Label.TextPattern = "{A:F0}°C";
    diagram.AxisX.GridLines.Visible = true;
}
static DataTable LoadDataTableFromXml(string fileName, string tableName) {
    DataSet xmlDataSet = new DataSet();
    xmlDataSet.ReadXml(fileName);
    return xmlDataSet.Tables[tableName];
}
The following API members configure the histogram options:
| Member | Description |
|---|---|
| ScaleGridOptionsBase.AggregateFunction | Gets or sets the value indicating the aggregate function that should be used to relieve data. |
| ScaleOptionsBase.ScaleMode | Gets or sets the scale mode for an axis. |
NumericScaleOptions.IntervalOptions |
Stores options for numeric axis when its ScaleMode is Interval. |
| NumericIntervalOptions.DivisionMode | Specifies how to divide axis scale into intervals. |
| NumericIntervalOptions.Count | Gets or sets the number of intervals when DivisionMode is Count. |
| NumericIntervalOptions.GridLayoutMode | Gets or sets the value that specifies the alignment of grid lines, major tickmarks and axis labels. |
See Also