NumericIntervalOptions.DivisionMode Property
Specifies how to divide axis scale into intervals.
Namespace: DevExpress.XtraCharts
Assembly: DevExpress.XtraCharts.v26.1.dll
Declaration
Property Value
| Type | Description |
|---|---|
| IntervalDivisionMode | The value that specifies the interval calculation method. |
Available values:
| Name | Description |
|---|---|
| Auto | The number of axis intervals and their size are automatically calculated. |
| Width | The NumericIntervalOptions.Width property specifies the axis interval size. |
| Count | The NumericIntervalOptions.Count property specifies the number of axis intervals. |
Property Paths
You can access this nested property as listed below:
| Object Type | Path to DivisionMode |
|---|---|
| NumericScaleOptions |
|
Example
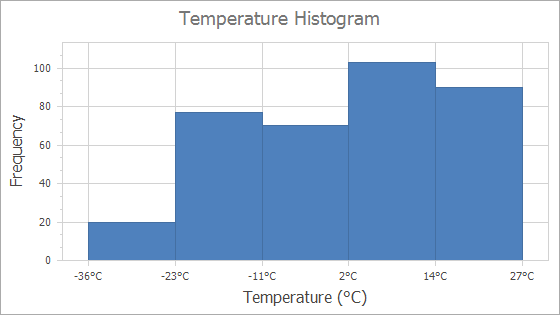
This example demonstrates how to create a histogram chart with a given number of bins.
private void Form1_Load(object sender, EventArgs e) {
    // Load data to a chart.
    chartControl1.DataSource = LoadDataTableFromXml("..\\..\\Data\\CityWeather.xml", "CityWeather");
    Series series = new Series();
    series.ArgumentDataMember = "Temperature";
    SideBySideBarSeriesView view = series.View as SideBySideBarSeriesView;
    view.Border.Visibility = DevExpress.Utils.DefaultBoolean.True;
    view.BarWidth = 1;
    chartControl1.Series.Add(series);
    // Configure histogram options.
    XYDiagram diagram = chartControl1.Diagram as XYDiagram;
    NumericScaleOptions scaleOptions = diagram.AxisX.NumericScaleOptions;
    scaleOptions.AggregateFunction = AggregateFunction.Histogram;
    scaleOptions.ScaleMode = ScaleMode.Interval;
    scaleOptions.IntervalOptions.DivisionMode = IntervalDivisionMode.Count;
    scaleOptions.IntervalOptions.Count = 5;
    scaleOptions.IntervalOptions.GridLayoutMode = GridLayoutMode.GridAndLabelShifted;
    diagram.AxisX.Label.TextPattern = "{A:F0}°C";
    diagram.AxisX.GridLines.Visible = true;
}
static DataTable LoadDataTableFromXml(string fileName, string tableName) {
    DataSet xmlDataSet = new DataSet();
    xmlDataSet.ReadXml(fileName);
    return xmlDataSet.Tables[tableName];
}
The following API members configure the histogram options:
| Member | Description |
|---|---|
| ScaleGridOptionsBase.AggregateFunction | Gets or sets the value indicating the aggregate function that should be used to relieve data. |
| ScaleOptionsBase.ScaleMode | Gets or sets the scale mode for an axis. |
| NumericScaleOptions.IntervalOptions | Stores options for numeric axis when its ScaleMode is Interval. |
NumericIntervalOptions.DivisionMode |
Specifies how to divide axis scale into intervals. |
| NumericIntervalOptions.Count | Gets or sets the number of intervals when DivisionMode is Count. |
| NumericIntervalOptions.GridLayoutMode | Gets or sets the value that specifies the alignment of grid lines, major tickmarks and axis labels. |
Related GitHub Examples
The following code snippet (auto-collected from DevExpress Examples) contains a reference to the DivisionMode property.
Note
The algorithm used to collect these code examples remains a work in progress. Accordingly, the links and snippets below may produce inaccurate results. If you encounter an issue with code examples below, please use the feedback form on this page to report the issue.