Series Data Point
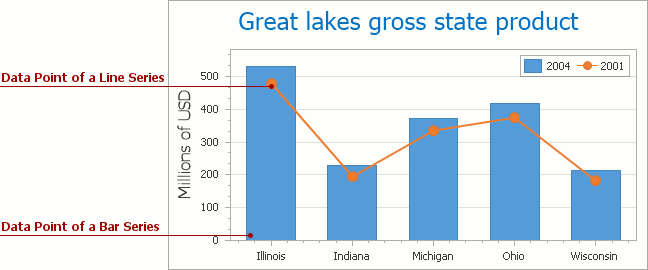
A Series Data Point (or a Series Point, for short) represents an individual data point within a series. Each data point is plotted on the diagram, based upon one X value (the point’s argument) and one or more Y values (the value(s) of the data point). Depending upon the view type of the series which owns a point, the point can be represented within a chart with the help of different chart elements (such as a bar, data point marker, pie slice) and can be identified by using series labels. For more detailed information, refer to Series Points.
The table below lists the main properties which affect the element’s appearance and functionality:
Availability | The Series.Points property of a series, the SeriesPointCollection.Item of a point collection. |
Appearance | |
Values | |
Behavior | SeriesBase.SeriesPointsSorting, SeriesBase.SeriesPointsSortingKey |
Custom Draw Event |