Spline Area
Short Description
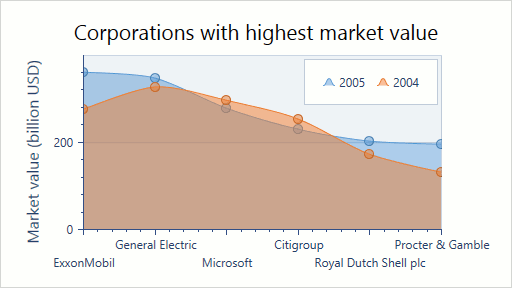
The Spline Area Chart is similar to Area Chart, but plots a fitted curve through each data point in a series.
A Spline Area chart is shown in the image below.
Series Characteristics
The table below lists the main characteristics of this chart type.
| Feature | Value |
|---|---|
| Series View type | SplineAreaSeries2D |
| Diagram type | 2D-XYDiagram2D |
| Number of arguments per series point | 1 |
| Number of values per series point | 1 |
For information on which series view types can be combined with the Spline Area view, refer to the Series Type Compatibility document.
Example
The following example demonstrates how to create a 2D Spline Area chart.