Radar Point
Short Description
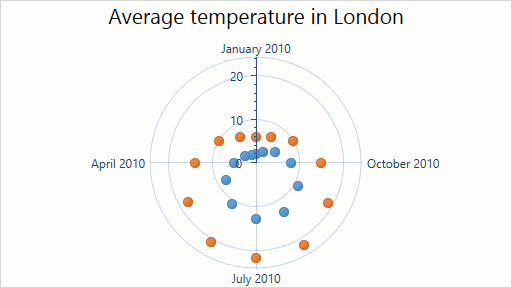
The Radar Point series is useful when it’s necessary to show points from two or more differing series on the same arguments on a circular grid that has multiple axes along which data can be plotted. Note that although these charts normally have a circular shape, they can also be displayed as a polygon.
An example of the Radar Point chart is shown in the image below.
Series Characteristics
The table below lists the main characteristics of this chart type.
| Feature | Value |
|---|---|
| Series View type | RadarPointSeries2D |
| Diagram type | RadarDiagram2D |
| Number of arguments per series point | 1 |
| Number of values per series point | 1 |
For information on which series view types can be combined with the Radar Point view, refer to the Series Type Compatibility document.
Example
The following example demonstrates how to create a 2D Radar Point chart.