TdxChartSeriesValueLabels.Appearance Property
Provides access to general appearance settings of series value labels.
Declaration
property Appearance: TdxChartSeriesValueLabelAppearance read; write;Property Value
| Type | Description |
|---|---|
| TdxChartSeriesValueLabelAppearance | Stores appearance settings of series value labels. |
Remarks
You can use Appearance.FontOptions and Appearance.TextColor properties to change the appearance of value label inscriptions.
Refer to the TdxChartSeriesValueLabelAppearance class description for detailed information on all available options.
Code Example: Customize Value Label Appearance
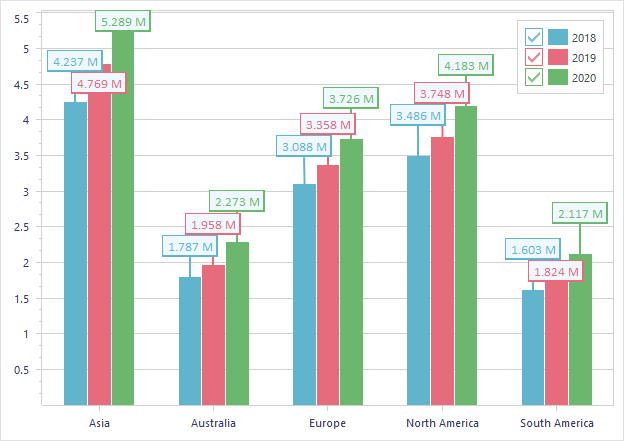
The code example in this section displays and configures value labels for 2018, 2019, and 2020 simple Bar series.
How to Test this Code Example
Follow the steps below to test this code example in your RAD Studio IDE:
- Copy the DFM code snippet demonstrated within the current section.
- Create a new project in the IDE and focus an empty form.
- Press Ctrl + V to populate the form with preconfigured components.
- Create an empty OnCreate event for the form, paste the code example, and run the project.
object dxChartControl1: TdxChartControl
   Left = 0
   Top = 0
   Width = 624
   Height = 441
   Align = alClient
   Titles = <>
   object dxChartControl1XYDiagram1: TdxChartXYDiagram
     object dxChartControl1XYSeries1: TdxChartXYSeries
       Caption = '2018'
       DataBindingType = 'DB'
       DataBinding.DataSource = DataSource1
       DataBinding.ArgumentField.FieldName = 'Region'
       DataBinding.ValueField.FieldName = '2018'
       ViewType = 'Bar'
       ShowInLegend = Diagram
       ColorSchemeIndex = 0
     end
     object dxChartControl1XYSeries2: TdxChartXYSeries
       Caption = '2019'
       DataBindingType = 'DB'
       DataBinding.DataSource = DataSource1
       DataBinding.ArgumentField.FieldName = 'Region'
       DataBinding.ValueField.FieldName = '2019'
       ViewType = 'Bar'
       ShowInLegend = Diagram
       ColorSchemeIndex = 1
     end
     object dxChartControl1XYSeries3: TdxChartXYSeries
       Caption = '2020'
       DataBindingType = 'DB'
       DataBinding.DataSource = DataSource1
       DataBinding.ArgumentField.FieldName = 'Region'
       DataBinding.ValueField.FieldName = '2020'
       ViewType = 'Bar'
       ShowInLegend = Diagram
       ColorSchemeIndex = 2
     end
   end
 end
 object dxSkinController1: TdxSkinController
   SkinName = 'WXI'
   SkinPaletteName = 'Office Colorful'
   Left = 552
   Top = 72
 end
 object dxMemData1: TdxMemData
   Active = True
   Indexes = <>
   Persistent.Data = {
     5665728FC2F5285C8FFE3F040000001400000014000700526567696F6E000800
     0000060005003230313800080000000600050032303139000800000006000500
     32303230000104000000410073006900610001DE718A8EE4F21040016DE7FBA9
     F1121340010E2DB29DEF27154001090000004100750073007400720061006C00
     6900610001D5E76A2BF697FC3F01C364AA605452FF3F011FF46C567D2E024001
     060000004500750072006F00700065000130BB270F0BB50840013EE8D9ACFADC
     0A400158A835CD3BCE0D40010D0000004E006F00720074006800200041006D00
     6500720069006300610001FCA9F1D24DE20B4001ECC039234AFB0D40017B14AE
     47E1BA1040010D00000053006F00750074006800200041006D00650072006900
     630061000186C954C1A8A4F93F0176711B0DE02DFD3F01C7BAB88D06F00040}
   SortOptions = []
   Left = 552
   Top = 136
   object dxMemData1Region: TWideStringField
     FieldName = 'Region'
   end
   object dxMemData12018: TFloatField
     FieldName = '2018'
   end
   object dxMemData12019: TFloatField
     FieldName = '2019'
   end
   object dxMemData12020: TFloatField
     FieldName = '2020'
   end
 end
 object DataSource1: TDataSource
   DataSet = dxMemData1
   Left = 552
   Top = 200
 end
var
  ADiagram: TdxChartXYDiagram;
  ABarView: TdxChartXYSeriesBarView;
  I: Integer;
begin
  ADiagram := dxChartControl1.Diagrams[0] as TdxChartXYDiagram;
  ADiagram.BeginUpdate;  // Initiates the following batch change
  try
    for I := 0 to ADiagram.SeriesCount - 1 do  // Iterates through all bar series in the diagram
    begin
      ABarView := ADiagram.Series[I].View as TdxChartXYSeriesBarView;
      ABarView.ValueLabels.Visible := True;  // Displays value labels for the current series
      ABarView.ValueLabels.Position := TdxChartBarValueLabelPosition.Top;
      ABarView.ValueLabels.LineLength := 30;
      ABarView.ValueLabels.Appearance.LineOptions.Width := 2.0;
      ABarView.ValueLabels.Appearance.FillOptions.Color := TdxAlphaColors.AliceBlue;
      ABarView.ValueLabels.Appearance.BorderThickness := 1.5;
      ABarView.ValueLabels.Appearance.FontOptions.Name := 'Calibri';
      ABarView.ValueLabels.Appearance.FontOptions.Size := 10;
      ABarView.ValueLabels.TextFormat := '{V:0.000} M';  // Defines a custom label formatting pattern
    end;
  finally
    ADiagram.EndUpdate;  // Calls EndUpdate regardless of the batch operation's success
  end;
end;

See Also