XYDiagram2D.DependentAxesYRange Property
Gets or sets whether the visual range of all Y-axes (axes of values) should be calculated only by values of points contained in the visual range of the X-axis (axis of arguments).
Namespace: DevExpress.XtraCharts
Assembly: DevExpress.XtraCharts.v25.2.dll
NuGet Package: DevExpress.Charts
Declaration
[XtraChartsLocalizableCategory(XtraChartsCategory.Behavior)]
public DefaultBoolean DependentAxesYRange { get; set; }Property Value
| Type | Description |
|---|---|
| DefaultBoolean | The value that defines whether the y-axis visual range should be calculated based on the x-axis visual range. |
Available values:
| Name | Description | Return Value |
|---|---|---|
| True | The value is true. |
|
| False | The value is false. |
|
| Default | The value is specified by a global option or a higher-level object. |
|
Remarks
The DependentAxesYRange property can have the following values:
Value | Description |
|---|---|
Default | The default behavior of the value visual range. |
True | The visual range should be calculated by the values of points contained in the visual range of the axis of arguments. |
False | The visual range should be calculated by all values. |
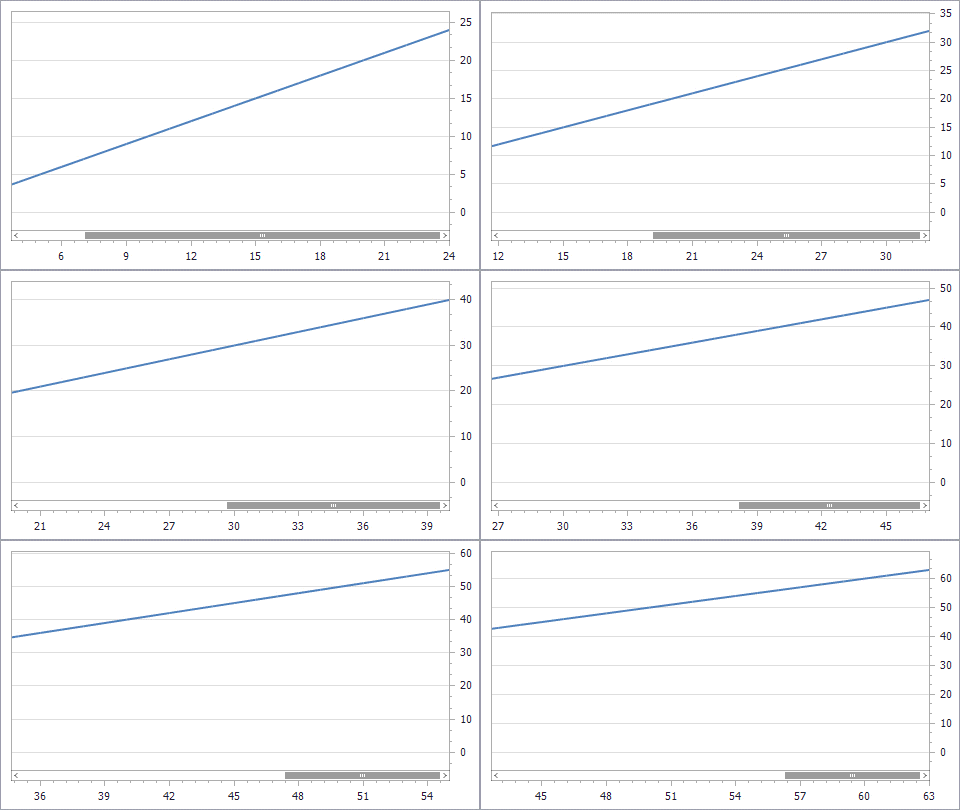
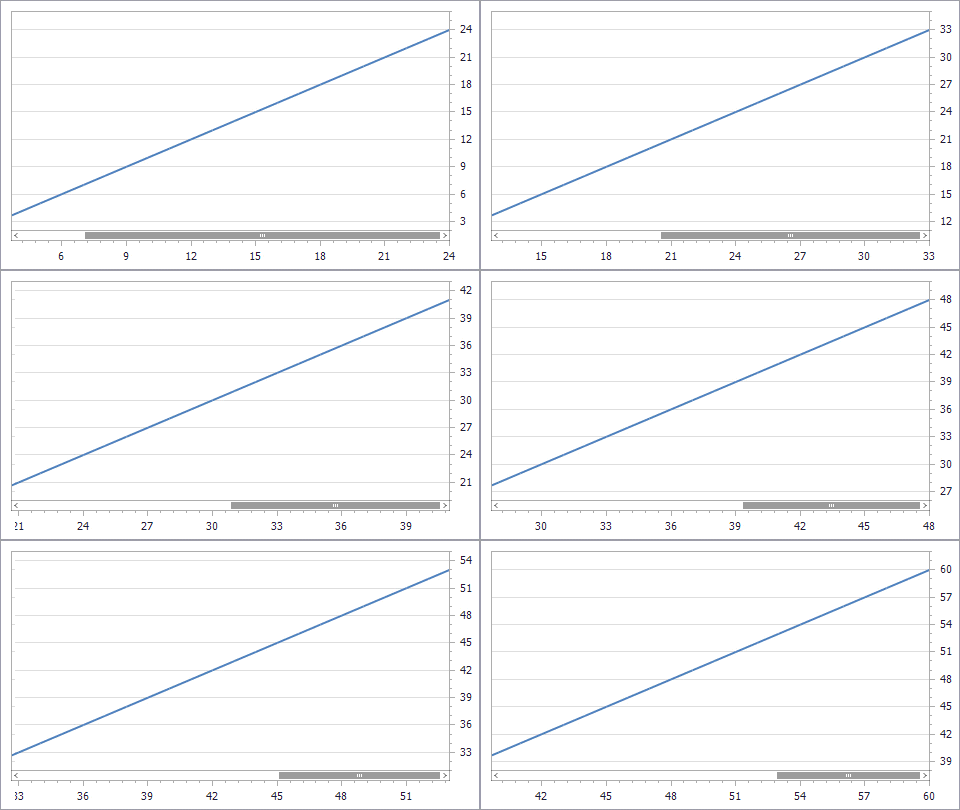
The following images demonstrates this property in action.
| DependentAxesYRange = false | DependentAxesYRange = true |
|---|---|
 |
 |
Note
The DependentAxesYRange and WholeRange.AlwaysShowZeroLevel properties are dependent. AlwaysShowZeroLevel is taken into account when the visual range is calculated.
Related GitHub Examples
The following code snippets (auto-collected from DevExpress Examples) contain references to the DependentAxesYRange property.
Note
The algorithm used to collect these code examples remains a work in progress. Accordingly, the links and snippets below may produce inaccurate results. If you encounter an issue with code examples below, please use the feedback form on this page to report the issue.