EmptyPointOptions.ProcessPoints Property
Specifies how the chart control handles empty series points.
Namespace: DevExpress.XtraCharts
Assembly: DevExpress.XtraCharts.v26.1.dll
Declaration
Property Value
| Type | Description |
|---|---|
| ProcessEmptyPointsMode | A ProcessEmptyPointsMode value that defines how to handle empty points. |
Available values:
| Name | Description | Image |
|---|---|---|
| InsertZero | The chart control initializes empty points with zero values. |
|
| Interpolate | The chart control initializes empty points with mock values calculated based on neighboring points. |
|
| Ignore | Empty points are skipped. |
|


Property Paths
You can access this nested property as listed below:
| Object Type | Path to ProcessPoints |
|---|---|
| XYDiagramSeriesViewBase |
|
Example
How to: Display Chart Empty Points
This example shows how to customize display options for empty points of a bar series view.
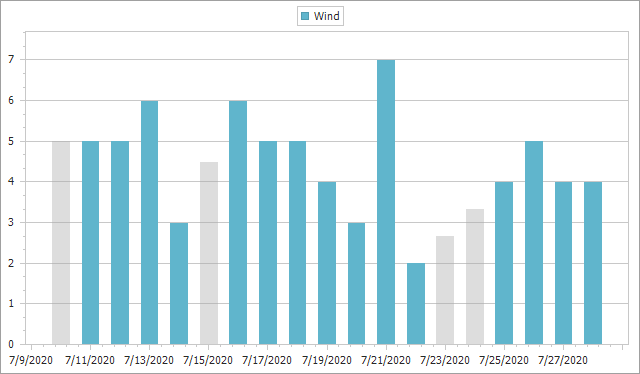
Cast the XYDiagramSeriesViewBase.EmptyPointOptions property to the EmptyPointOptions type to access a series’ empty point settings.
Specify the ProcessPoints property to define how the chart handles empty points. In this example, the chart calculates mock values for empty points.
using DevExpress.XtraCharts;
using System;
using System.Collections.Generic;
using System.Drawing;
using System.Windows.Forms;

namespace EmptyPointRepsentation {
    public partial class Form1 : Form {
        ChartControl chart { get { return chartControl1; } }
        public Form1() {
            InitializeComponent();

            chart.DataSource = WeatherDataProvider.Data;
            Series series = new Series("Wind", ViewType.Bar);
            series.SetDataMembers("Date", "Wind");
            chart.Series.Add(series);

            BarSeriesView view = (BarSeriesView)series.View;

            EmptyPointOptions emptyPointOptions = view.EmptyPointOptions;
            emptyPointOptions.ProcessPoints = ProcessEmptyPointsMode.Interpolate;
            emptyPointOptions.Color = Color.FromArgb(100, Color.DarkGray);

        }
    }

    public static class WeatherDataProvider {
        static List<WeatherPoint> data;

        public static List<WeatherPoint> Data {
            get {
                if (data == null)
                    InitCollection();
                return data;
            }
        }
        static void InitCollection() {
            data = new List<WeatherPoint>();
            int lastYear = DateTime.Now.Year - 1;
            data.Add(new WeatherPoint() { Date = new DateTime(lastYear, 7, 10) });
            data.Add(new WeatherPoint() { Date = new DateTime(lastYear, 7, 11), Wind = 5 });
            data.Add(new WeatherPoint() { Date = new DateTime(lastYear, 7, 12), Wind = 5 });
            data.Add(new WeatherPoint() { Date = new DateTime(lastYear, 7, 13), Wind = 6 });
            data.Add(new WeatherPoint() { Date = new DateTime(lastYear, 7, 14), Wind = 3 });
            data.Add(new WeatherPoint() { Date = new DateTime(lastYear, 7, 15) });
            data.Add(new WeatherPoint() { Date = new DateTime(lastYear, 7, 16), Wind = 6 });
            data.Add(new WeatherPoint() { Date = new DateTime(lastYear, 7, 17), Wind = 5 });
            data.Add(new WeatherPoint() { Date = new DateTime(lastYear, 7, 18), Wind = 5 });
            data.Add(new WeatherPoint() { Date = new DateTime(lastYear, 7, 19), Wind = 4 });
            data.Add(new WeatherPoint() { Date = new DateTime(lastYear, 7, 20), Wind = 3 });
            data.Add(new WeatherPoint() { Date = new DateTime(lastYear, 7, 21), Wind = 7 });
            data.Add(new WeatherPoint() { Date = new DateTime(lastYear, 7, 22), Wind = 2 });
            data.Add(new WeatherPoint() { Date = new DateTime(lastYear, 7, 23) });
            data.Add(new WeatherPoint() { Date = new DateTime(lastYear, 7, 24) });
            data.Add(new WeatherPoint() { Date = new DateTime(lastYear, 7, 25), Wind = 4 });
            data.Add(new WeatherPoint() { Date = new DateTime(lastYear, 7, 26), Wind = 5 });
            data.Add(new WeatherPoint() { Date = new DateTime(lastYear, 7, 27), Wind = 4 });
            data.Add(new WeatherPoint() { Date = new DateTime(lastYear, 7, 28), Wind = 4 });
        }

        public class WeatherPoint {
            public DateTime Date { get; set; }
            public double? Wind { get; set; }
        }
    }
}