Bubble
- 6 minutes to read
Description
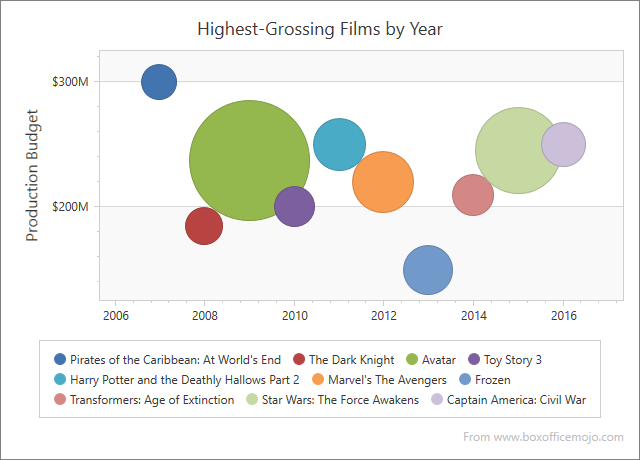
The Bubble series allows you to display data with three dimensions: the position of each series point on the X and Y-axes indicates values of two dimensions, and the bubble’s size the third dimension.
The image below shows an example of a Bubble chart:
Main characteristics:
| Feature | Value |
|---|---|
| Series View type | BubbleSeries2D |
| Diagram type | XYDiagram2D |
| Number of arguments per series point | 1 |
| Number of values per series point | 2 |
Create Bubble Series in Markup
The following example creates a 2D Bubble chart. Assign an XYDiagram2D object to the ChartControl.Diagram property and add a BubbleSeries2D object with points to the Diagram.Series collection.
This example also customizes the Y-axis’s whole range and a crosshair cursor.
<Window x:Class="Bubble2DChart.Window1" xmlns="http://schemas.microsoft.com/winfx/2006/xaml/presentation"
        xmlns:x="http://schemas.microsoft.com/winfx/2006/xaml"
        xmlns:dxc="http://schemas.devexpress.com/winfx/2008/xaml/charts" Title="Window1">
    <Grid>
        <dxc:ChartControl>
            <dxc:ChartControl.CrosshairOptions>
                <dxc:CrosshairOptions ShowValueLine="True" ShowValueLabels="True"/>
            </dxc:ChartControl.CrosshairOptions>
            <dxc:ChartControl.Diagram>
                <dxc:XYDiagram2D>
                    <dxc:XYDiagram2D.Series>
                        <dxc:BubbleSeries2D Transparency="0.2"
                                            AutoSize="False"
                                            MinSize="1"
                                            MaxSize="3"
                                            ColorEach="True"
                                            CrosshairLabelPattern="Argument: {A}; Value: {V}; Weight: {W}">
                            <dxc:BubbleSeries2D.Points>
                                <dxc:SeriesPoint Argument="A" Value="100" dxc:BubbleSeries2D.Weight="0.9" />
                                <dxc:SeriesPoint Argument="B" Value="60" dxc:BubbleSeries2D.Weight="0.8" />
                                <dxc:SeriesPoint Argument="C" Value="30" dxc:BubbleSeries2D.Weight="0.5" />
                                <dxc:SeriesPoint Argument="D" Value="43" dxc:BubbleSeries2D.Weight="0.4" />
                                <dxc:SeriesPoint Argument="E" Value="11" dxc:BubbleSeries2D.Weight="0.4"/>
                                <dxc:SeriesPoint Argument="F" Value="29" dxc:BubbleSeries2D.Weight="0.2"/>
                                <dxc:SeriesPoint Argument="G" Value="12" dxc:BubbleSeries2D.Weight="0.2"/>
                                <dxc:SeriesPoint Argument="H" Value="21" dxc:BubbleSeries2D.Weight="0.2"/>
                                <dxc:SeriesPoint Argument="I" Value="28" dxc:BubbleSeries2D.Weight="0.2"/>
                            </dxc:BubbleSeries2D.Points>
                        </dxc:BubbleSeries2D>
                    </dxc:XYDiagram2D.Series>
                    <dxc:XYDiagram2D.AxisY>
                        <dxc:AxisY2D GridLinesMinorVisible="True" >
                            <dxc:AxisY2D.WholeRange>
                                <dxc:Range MinValue="0" MaxValue="130"
                                           SideMarginsValue="0" />
                            </dxc:AxisY2D.WholeRange>
                        </dxc:AxisY2D>
                    </dxc:XYDiagram2D.AxisY>
                </dxc:XYDiagram2D>
            </dxc:ChartControl.Diagram>
        </dxc:ChartControl>
    </Grid>
</Window>
Create Bubble Series in Code
Follow the steps below to create a 2D Bubble chart in code:
Define an XYDiagram2D object and assign it to the ChartControl.Diagram property.
Create an instance of the BubbleSeries2D class and add it to the Diagram.Series collection.
Create series points and add them to the Series.Points collection. Use the SetWeight(SeriesPoint, Double) method to specify the weight for each series point.
private void Window_Loaded(object sender, RoutedEventArgs e) {
    // Create a chart.
    ChartControl chart = new ChartControl();

    // Create a diagram.
    XYDiagram2D diagram = new XYDiagram2D();
    chart.Diagram = diagram;

    // Create a bubble series.
    BubbleSeries2D series = new BubbleSeries2D();
    diagram.Series.Add(series);

    // Add points to the series.
    SeriesPoint point1 = new SeriesPoint("A", 70);
    BubbleSeries2D.SetWeight(point1, 1);
    series.Points.Add(point1);

    SeriesPoint point2 = new SeriesPoint("B", 30);
    BubbleSeries2D.SetWeight(point2, 1.7);
    series.Points.Add(point2);

    SeriesPoint point3 = new SeriesPoint("C", 60);
    BubbleSeries2D.SetWeight(point3, 1.2);
    series.Points.Add(point3);

    SeriesPoint point4 = new SeriesPoint("D", 43);
    BubbleSeries2D.SetWeight(point4, 0.8);
    series.Points.Add(point4);

    series.ColorEach = true;
    series.Transparency = 0.1;
    series.MarkerModel = new PentagonMarker2DModel();

    // Add the chart to the window.
    this.Content = chart;
}
Bind Bubble Series to a Data Source
Use the following properties to bind a 2D Bubble chart to data:
- DataSource - the series data source.
- ArgumentDataMember - a data member that contains series point arguments.
- ValueDataMember - a data member that contains series point values.
- WeightDataMember - a data member that contains series point weight.
<Window
        xmlns="http://schemas.microsoft.com/winfx/2006/xaml/presentation"
        xmlns:x="http://schemas.microsoft.com/winfx/2006/xaml"
        xmlns:d="http://schemas.microsoft.com/expression/blend/2008"
        xmlns:mc="http://schemas.openxmlformats.org/markup-compatibility/2006"
        xmlns:local="clr-namespace:BubbleChartDataBinding"
        xmlns:dxc="http://schemas.devexpress.com/winfx/2008/xaml/charts" x:Class="BubbleChartDataBinding.MainWindow"
        mc:Ignorable="d"
        Title="MainWindow" Height="450" Width="800">
    <Window.DataContext>
        <local:ChartViewModel/>
    </Window.DataContext>
    <Grid>
        <dxc:ChartControl>
            <dxc:ChartControl.CrosshairOptions>
                <dxc:CrosshairOptions ShowValueLine="True" ShowValueLabels="True"/>
            </dxc:ChartControl.CrosshairOptions>
            <dxc:ChartControl.Diagram>
                <dxc:XYDiagram2D>
                    <dxc:XYDiagram2D.Series>
                        <dxc:BubbleSeries2D Transparency="0.2"
                                            AutoSize="False"
                                            MinSize="0.8"
                                            MaxSize="2.7"
                                            ColorEach="True"
                                            DataSource="{Binding Data}"
                                            ArgumentDataMember="Year"
                                            ValueDataMember="Budget"
                                            WeightDataMember="Grosses">
                        </dxc:BubbleSeries2D>
                    </dxc:XYDiagram2D.Series>
                </dxc:XYDiagram2D>
            </dxc:ChartControl.Diagram>
        </dxc:ChartControl>
    </Grid>
</Window>
using System.Data;
using System.Windows;

namespace BubbleChartDataBinding {
    public partial class MainWindow : Window {
        public MainWindow() {
            InitializeComponent();
        }
    }
    public class ChartViewModel {
        public DataTable Data {
            get { return GetData(); }
        }
        public DataTable GetData() {
            DataTable table = new DataTable();
            table.Columns.AddRange(new DataColumn[] { new DataColumn("Year", typeof(int)),
                                                      new DataColumn("Budget", typeof(decimal)),
                                                      new DataColumn("Grosses", typeof(decimal)),
                                                      new DataColumn("Title", typeof(string)) });

            table.Rows.Add(2007, 300, 0.963, "Pirates of the Caribbean: At World's End");
            table.Rows.Add(2008, 185, 1.004, "The Dark Knight");
            table.Rows.Add(2009, 237, 2.788, "Avatar");
            table.Rows.Add(2010, 200, 1.067, "Toy Story 3");
            table.Rows.Add(2011, 250, 1.341, "Harry Potter and the Deathly Hallows Part 2");
            table.Rows.Add(2012, 220, 1.519, "Marvel's The Avengers");
            table.Rows.Add(2013, 150, 1.276, "Frozen");
            table.Rows.Add(2014, 210, 1.104, "Transformers: Age of Extinction");
            table.Rows.Add(2015, 245, 2.068, "Star Wars: The Force Awakens");
            table.Rows.Add(2016, 250, 1.153, "Captain America: Civil War");
            return table;
        }
    }
}
Configure Bubble Size
The Chart Control calculates a bubble’s size based on the Weight value. Set the BubbleSeries2D.AutoSize property to false to specify maximum and minimum bubble sizes. To do this, use the BubbleSeries2D.MaxSize and BubbleSeries2D.MinSize properties. The maximum and minimum values are calculated in X-axis units.
<dxc:BubbleSeries2D AutoSize="False" MinSize="1" MaxSize="3">
  <!--...-->
</dxc:BubbleSeries2D>
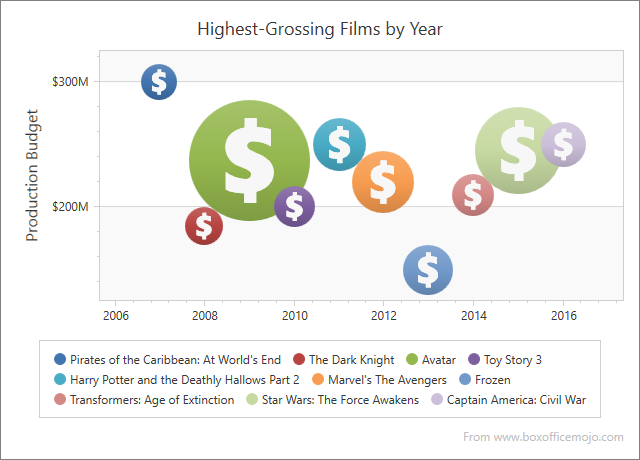
Specify Point Marker Type
You can use different shapes (crosses, stars, triangles, etc.) to display series points. To do this, specify the MarkerModel property:
<dxc:BubbleSeries2D>
  <dxc:BubbleSeries2D.MarkerModel>
    <dxc:DollarMarker2DModel/>
  </dxc:BubbleSeries2D.MarkerModel>
</dxc:BubbleSeries2D>
Result:
All available models are listed in the following help topic: Series and Marker Models: Predefined Models for Series Markers.
You can also specify a custom model as described in the following section: Series and Marker Models: Custom Model for 2D Series Markers.
Note
For information on which series view types can be combined with the Bubble view, refer to the following document: Series Type Compatibility.