TdxChartCustomDiagram.OnGetValueLabelDrawParameters Event
Allows you to customize series value labels.
Declaration
property OnGetValueLabelDrawParameters: TdxChartGetValueLabelDrawParametersEvent read; write;Remarks
You can handle OnGetSeriesPointDrawParameters and OnGetValueLabelDrawParameters events to customize individual series points and their value labels based on certain conditions. For example, you can handle the OnGetValueLabelDrawParameters event to display different measurement units for different series points.
Event Occurrence
The OnGetValueLabelDrawParameters event occurs every time the diagram is about to determine how to draw a series value label.
Event Parameters
The following parameters are available within an OnGetValueLabelDrawParameters event handler:
Sender- This parameter provides access to the diagram that raised the value label customization event.
AArgs- This parameter allows you to identify the processed value label and change it based on certain conditions.
Refer to the TdxChartGetValueLabelDrawParametersEvent procedural type description for detailed information on all parameters accessible in an OnGetValueLabelDrawParameters event handler.
Code Example: Display Multiple Measurement Units in Value Labels
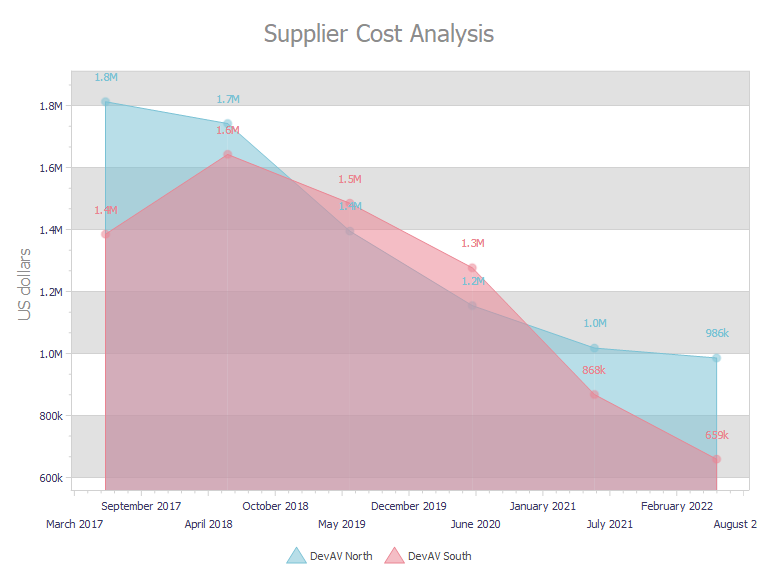
The code example below displays different measurement units in value labels. If a series value exceeds one million, the corresponding value label displays the million digits followed by the M character. If a series value exceeds one thousand but is less than one million, the corresponding value label displays the thousands digits followed by the k character.
procedure TMyForm.cdAreaGetValueLabelDrawParameters(Sender: TdxChartCustomDiagram;
  AArgs: TdxChartGetValueLabelDrawParametersEventArgs);
begin
  if AArgs.SeriesPoint.Value >= 1000 * 1000 then // Millions
    AArgs.Text := Format('%.1fM', [AArgs.SeriesPoint.Value / (1000 * 1000)])
  else if AArgs.SeriesPoint.Value >= 1000 then // Thousands
    AArgs.Text := Format('%.0fk', [AArgs.SeriesPoint.Value / 1000])
  else
    AArgs.Text := Format('%0f', [AArgs.SeriesPoint.Value]);
end;
