Dashboard Items
- 4 minutes to read
The DevExpress Dashboard provides elements that display visual or textual information in a dashboard - dashboard items. For instance, the Chart displays data using interactive graphs; the Grid displays data in a tabular form; Maps allow you to place callouts, bubbles or pies on the map using geographical coordinates, etc.
Dashboard items can be divided into the following groups:
Data Visualization Items
Data visualization items represent UI elements used to display data in the dashboard.
Dashboard Item | Image | Description | API |
|---|---|---|---|
Chart |
| Displays data graphically using bars, lines, points, etc. | |
Scatter Chart |
| Allows you to visualize relationships between numeric variables. | |
Grid |
| Allows you to display data in tabular form. | |
Pies |
| Displays a series of pies or donuts that represent each value’s contribution to the total value. | |
Cards |
| Displays a series of KPI elements (cards), each illustrating the difference between two values. | |
Gauges |
| Visualizes data with KPI elements (gauges). Each gauge measures progress toward a goal / KPI. | |
Pivot |
| Displays cross-tabular reports and allows you to analyze multi-dimensional data. | |
Choropleth Map |
| Allows you to colorize areas in proportion to the provided values. | |
Geo Point Map |
| Allows you to place callouts on the map using geographical coordinates. | |
Bubble Map |
| Displays bubbles on the map using geographical coordinates. | |
Pie Map |
| Allows you to place pies on the map using geographical coordinates. | |
Range Filter |
| Allows end-users to apply filters by dragging selection thumbs along the argument axis. | |
Images |
| Allows you to add static images or use images located in a data store. | DashboardCommon.ImageDashboardItem |
Text Box |
| Displays rich text in a dashboard. | |
Treemap |
| Allows you to visualize data in nested rectangles. | |
Custom Item |
| Allows you to implement and embed any additional items into the Web Dashboard. |


Filter Elements
Filter elements are used to apply filtering to other dashboard items.
Filter Element | Image | Description | API |
|---|---|---|---|
Combo Box |
| Allows end-users to select a value(s) from the drop-down list. | |
List Box |
| Allows end-users to select a value(s) from the list. | |
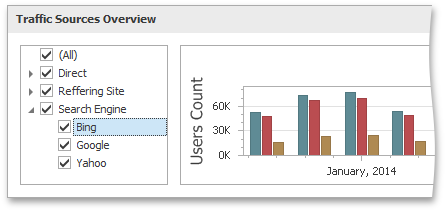
Tree View |
| Displays values hierarchically and allows end-users to filter other dashboard items by selecting parent/child values. | |
Date Filter |
| Allows end-users to filter other dashboard items by date-time values. |


Dashboard Item Containers
Containers are used to arrange items and manage dashboard items interaction within and outside the container.
Container | Image | Description | API |
|---|---|---|---|
Dashboard Item Group |
| The Dashboard item group arranges dashboard items and allows you to manage interaction between dashboard items within and outside the group. | |
Dashboard Tab Container |
| The Dashboard Tab container enables you to split the dashboard layout into several pages. | DashboardCommon.TabContainerDashboardItem DashboardCommon.DashboardTabPage |