Series Types in Blazor Charts
- 6 minutes to read
Blazor charts implement more than 20 series types. You can combine multiple series within the same component.
Series Declaration
To create a series, choose the series type and specify its ArgumentField and ValueField properties to populate the component with arguments and values. Since series are generic components, you must ensure that your markup defines the argument and value fields and their data types. The following code snippets demonstrate two ways of defining a series:
<DxChart Data="forecasts">
    <DxChartAreaSeries ArgumentField="@((WeatherForecast v) => v.Date)"
                       ValueField="@((WeatherForecast v) => v.TemperatureC)" />
    @* ... *@
</DxChart>
You can also use the Data property on the series level to specify the data source for a particular series if this source is different from the data assigned to the component.
Some series types, such as financial or bubble, require additional settings to render data. Refer to sections below for additional information about series types and how to create them.
If you add multiple series to <DxChart> or <DxPolarChart>, the component displays data on the same plane. The series appear on the plane in the order they are declared in the markup: the first series is displayed above all other series. Muiltiple series in one <DxPieChart> result in multiple nested rings in the same pie.
Area Series
The table below lists available area-based series and their markup objects:
| View Type | Series Object | Image |
|---|---|---|
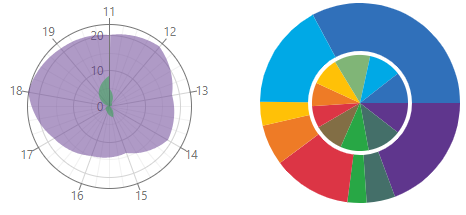
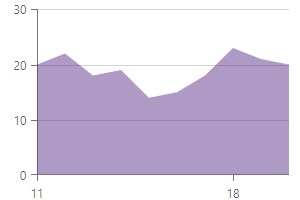
| Area | DxChartAreaSeries DxPolarChartAreaSeries |
 |
| Range Area | DxChartRangeAreaSeries | 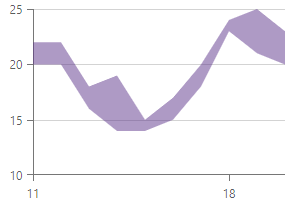 |
| Spline Area | DxChartSplineAreaSeries |  |
| Step Area | DxChartStepAreaSeries | 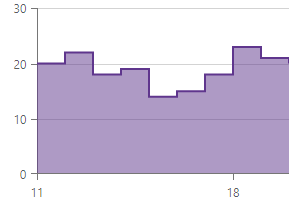 |
| Stacked Area | DxChartStackedAreaSeries | 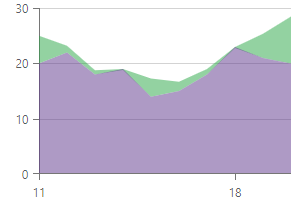 |
| Stacked Spline Area | DxChartStackedSplineAreaSeries | 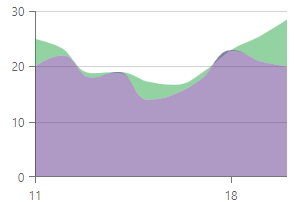 |
| Full-Stacked Area | DxChartFullStackedAreaSeries | 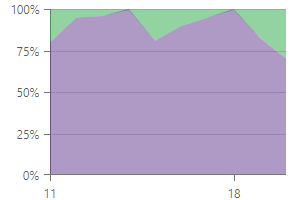 |
| Full-Stacked Spline Area | DxChartFullStackedSplineAreaSeries | 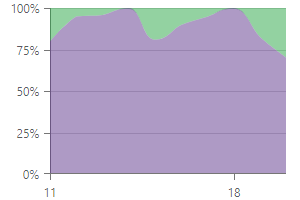 |
The following snippet creates an area series. You can replace the <DxChartAreaSeries> tag with other series objects to create another area-based series in <DxChart>.
<DxChart Data="forecasts">
    <DxChartAreaSeries ArgumentField="@((WeatherForecast v) => v.Date)"
                       ValueField="@((WeatherForecast v) => v.TemperatureC)" />
    @* ... *@
</DxChart>
Bar Series
The table below lists available bar-based series and their markup objects:
| View Type | Series Object | Image |
|---|---|---|
| Bar | DxChartBarSeries DxPolarChartBarSeries |
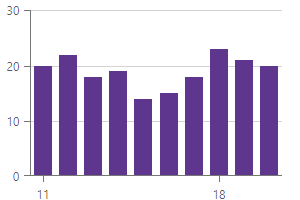 |
| Range Bar | DxChartRangeBarSeries | 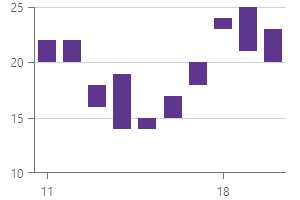 |
| Stacked Bar | DxChartStackedBarSeries DxPolarChartStackedBarSeries |
 |
| Full-Stacked Bar | DxChartFullStackedBarSeries | 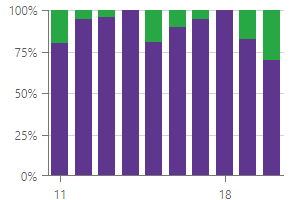 |
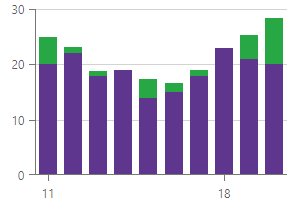
| Side-by-Side Stacked Bar | DxChartStackedBarSeries DxPolarChartBarSeries |
 |
| Side-by-Side Full-Stacked Bar | DxChartFullStackedBarSeries | 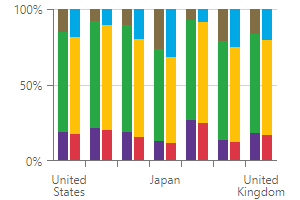 |
The following snippet creates a bar series. You can replace the <DxChartBarSeries> tag with other series objects to create another bar-based series in <DxChart>.
<DxChart Data="forecasts">
    <DxChartBarSeries ArgumentField="@((WeatherForecast v) => v.Date)"
                      ValueField="@((WeatherForecast v) => v.TemperatureC)" />
    @* ... *@
</DxChart>
If you want to create a side-by-side chart, specify the Stack property:
<DxChart Data="forecasts">
    <DxChartStackedBarSeries ArgumentField="@((WeatherForecast v) => v.Date)"
                             ValueField="@((WeatherForecast v) => v.TemperatureC)"
                             Stack="temperature" />
    <DxChartStackedBarSeries ArgumentField="@((WeatherForecast v) => v.Date)"
                             ValueField="@((WeatherForecast v) => v.Precipitation)"
                             Stack="precipitation" />
    @* ... *@
</DxChart>
Bubble Series
The table below contains information about a bubble series:
| View Type | Series Object | Image |
|---|---|---|
| Bubble | DxChartBubbleSeries | 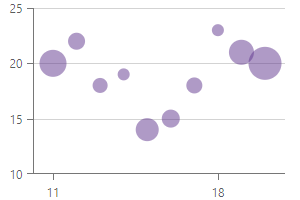 |
In addition to ArgumentField and ValueField properties, you should also map a data field to the SizeField property to render a bubble series:
<DxChart Data="forecasts">
    <DxChartBubbleSeries ArgumentField="@((WeatherForecast v) => v.Date)"
                         ValueField="@((WeatherForecast v) => v.TemperatureC)"
                         SizeField="@(((WeatherForecast v) => v.BubbleSize))" />
    @* ... *@
</DxChart>
Financial Series
The table below lists available financial series and their markup objects:
| View Type | Series Object | Image |
|---|---|---|
| Candlestick | DxChartCandlestickSeries | 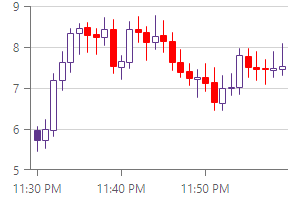 |
| OHLC | DxChartStockSeries | 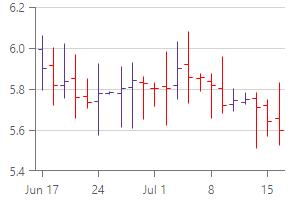 |
To create a financial series, specify ArgumentField, OpenField, HighField, LowField, CloseField properties:
<DxChart Data="forecasts">
    <DxChartCandlestickSeries OpenField="(StockDataPoint sdp) => sdp.Open"
                              HighField="sdp => sdp.High"
                              LowField="sdp => sdp.Low"
                              CloseField="sdp => sdp.Close"
                              ArgumentField="sdp => sdp.DateTimeStamp"
                              Name="Eco Supreme" />
    @* ... *@
</DxChart>
Line Series
The table below lists available line-based series and their markup objects:
| View Type | Series Object | Image |
|---|---|---|
| Line | DxChartLineSeries DxPolarChartLineSeries |
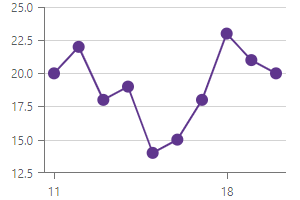 |
| Spline | DxChartSplineSeries |  |
| Step Line | DxChartStepLineSeries | 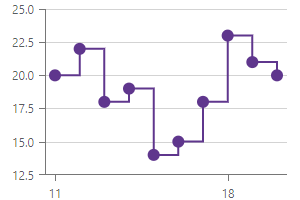 |
| Stacked Line | DxChartStackedLineSeries | 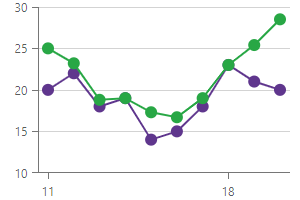 |
| Stacked Spline | DxChartStackedSplineSeries | 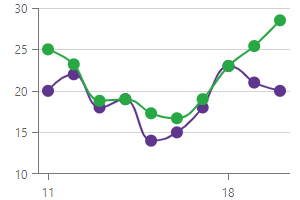 |
| Full-Stacked Line | DxChartFullStackedLineSeries | 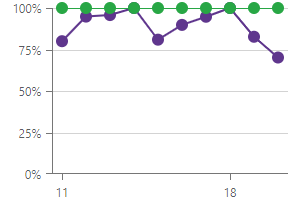 |
| Full-Stacked Spline | DxChartFullStackedSplineSeries | 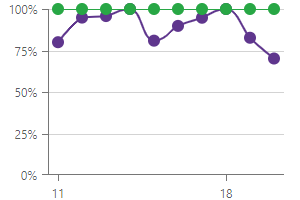 |
The following snippet creates a line series. You can replace the <DxChartLineSeries> tag with other series objects to create another line-based series in <DxChart>.
<DxChart Data="forecasts">
    <DxChartLineSeries ArgumentField="@((WeatherForecast v) => v.Date)"
                       ValueField="@((WeatherForecast v) => v.TemperatureC)" />
    @* ... *@
</DxChart>
Scatter Series
The table below contains information about a scatter series:
| View Type | Series Object | Image |
|---|---|---|
| Scatter | DxChartScatterSeries DxPolarChartScatterSeries |
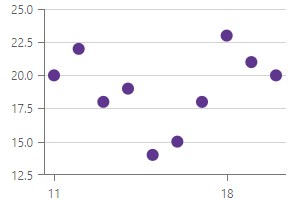 |
The following snippet creates a scatter series:
<DxChart Data="forecasts">
    <DxChartScatterSeries ArgumentField="@((WeatherForecast v) => v.Date)"
                          ValueField="@((WeatherForecast v) => v.TemperatureC)" />
    @* ... *@
</DxChart>
Pie and Donut Series
<DxPieChart> supports one series type – DxPieChartSeries. Use this series to create the following views:
| View Type | Series Object | Image |
|---|---|---|
| Donut | DxPieChartSeries | 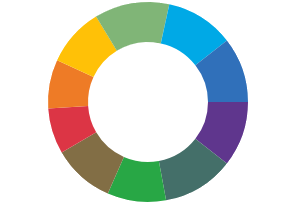 |
| Pie | DxPieChartSeries |  |
The following snippet creates a pie series:
<DxPieChart Data="forecasts">
    <DxPieChartSeries ArgumentField="@((WeatherForecast v) => v.Date)"
                      ValueField="@((WeatherForecast v) => v.TemperatureC)" />
    @* ... *@
</DxPieChart>
Specify the InnerDiameter property to create a donut chart:
<DxPieChart Data="forecasts" InnerDiameter="0.6">
    <DxPieChartSeries ArgumentField="@((WeatherForecast v) => v.Date)"
                      ValueField="@((WeatherForecast v) => v.TemperatureC)" />
    @* ... *@
</DxPieChart>