Our Blazor Charts allow you to visualize data stored in IEnumerable<T> collections. This article describes how to bind Blazor Charts to data in different scenarios.
Follow the steps below to bind a chart to data and display this data within the component:
- Use the DxChart.Data, DxPolarChart.Data, or DxPieChart.Data property to specify a data source.
- Declare series objects in the component markup and specify their
ArgumentField and ValueField properties.
You can also use the Data property on the series level to specify the data source for a particular series if this source differs from the data assigned to the component. For additional information about available series types and their configuration requirements, refer to the following article: Series Types in Blazor Charts.
The chart may update itself automatically or on-demand, as listed below. Regardless of update cause, you can handle the Rendered event to track the moment when the chart rendering is finished and the component is completely loaded.
- Data-related updates: If the data source collection implements the INotifyCollectionChanged interface, the Chart is updated automatically each time the collection changes. Call the RefreshData method to reload data and redraw the component on-demand.
- Layout-related updates: The Chart redraws itself when a user resizes the component’s root container. Set the RedrawOnResize property to
false to disable this behavior. To re-render the Chart area on-demand, call the RedrawAsync method.
For additional information about data updates in Blazor data-bound components, refer to the following article: Update Data in Data-Bound Components.
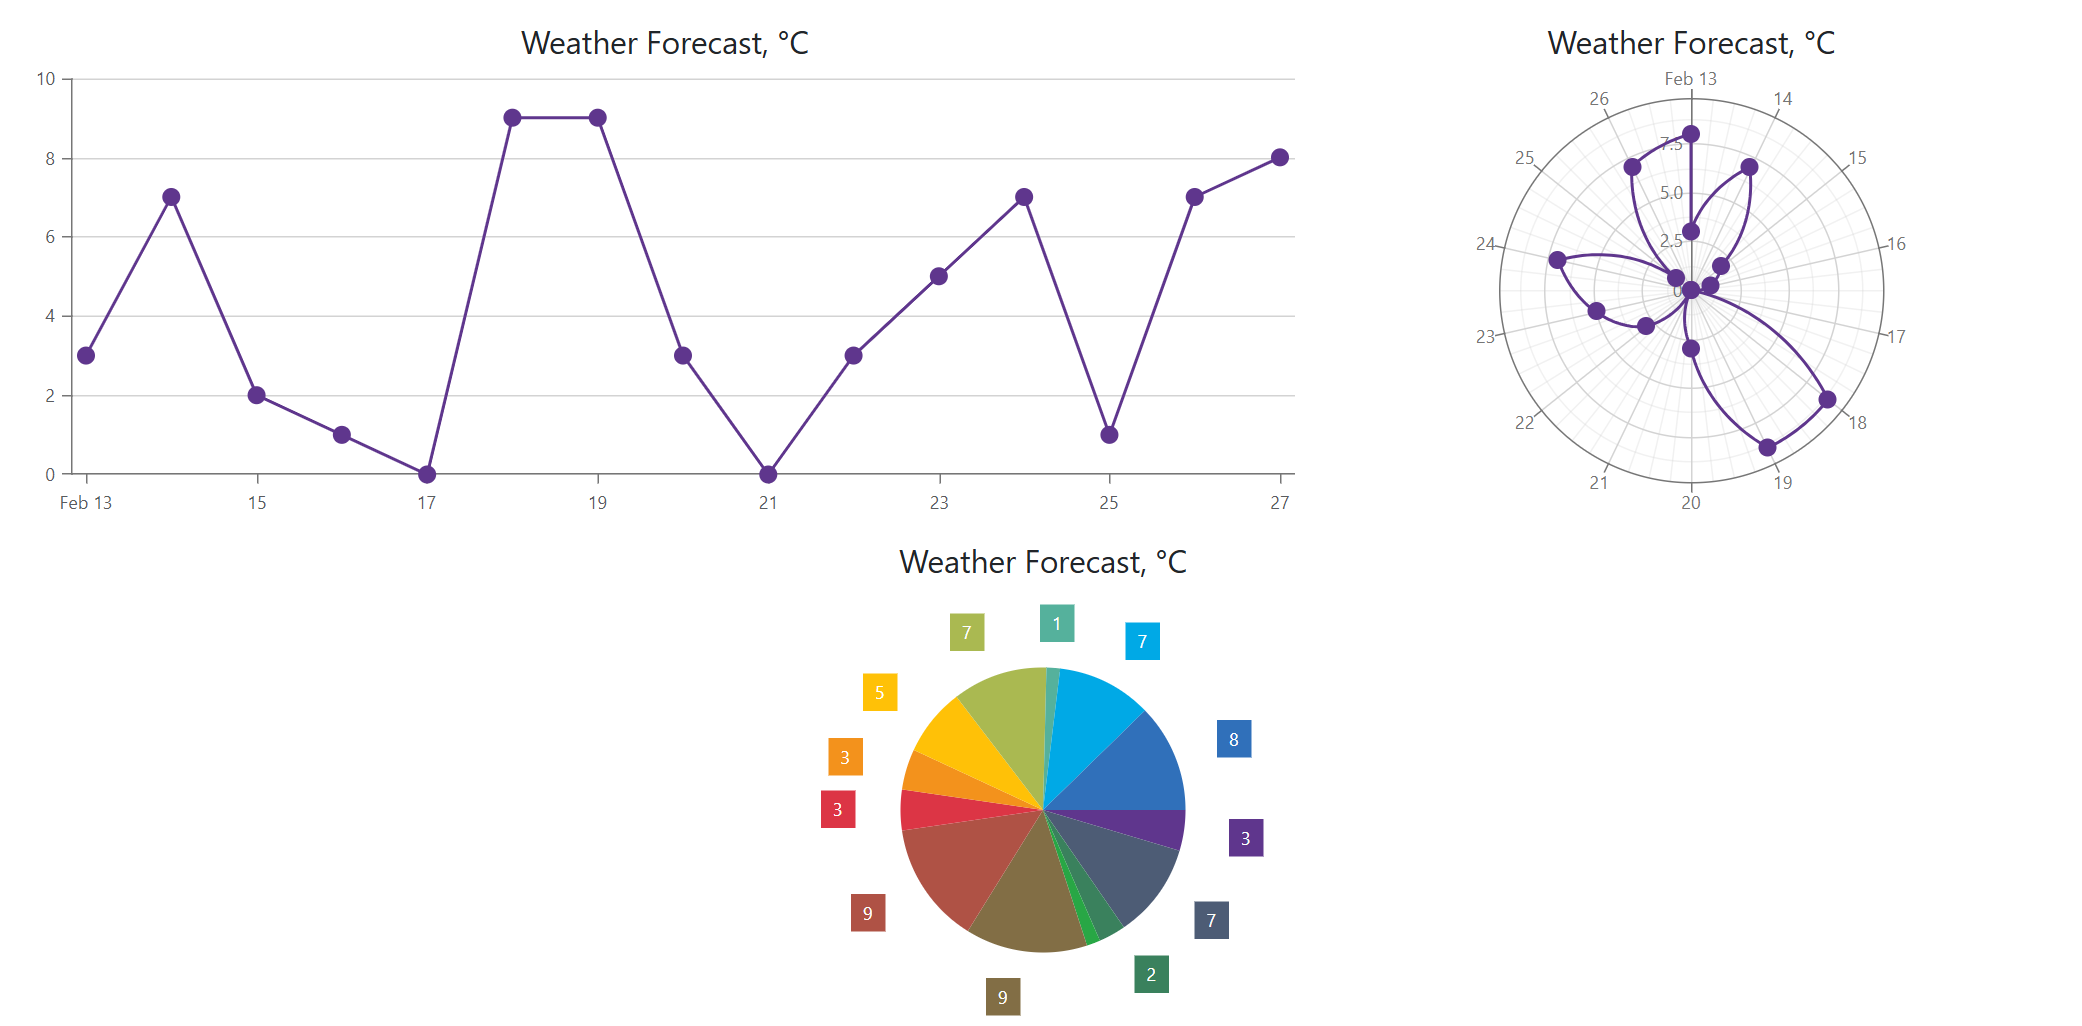
Synchronous Data Binding
Follow the steps below to bind a chart to a data collection available during synchronous component initialization:
- Bind the
Data parameter to a C# field or property.
- Populate this field or property with data in the OnInitialized lifecycle method.
@inject WeatherForecastService ForecastService

<DxChart Data="@ChartData">
    <DxChartLineSeries ValueField="@((WeatherForecast i) => i.TemperatureC)"
                       ArgumentField="@(i => i.Date.Date)"
                       Name="Temperature, C" />
    <DxChartTitle Text="Weather Forecast, °C" />
    <DxChartLegend Visible="false" />
</DxChart>

@code {
    IEnumerable<WeatherForecast> ChartData;

    protected override void OnInitialized() {
        ChartData = ForecastService.GetForecast();
    }
}
@inject WeatherForecastService ForecastService

<DxPolarChart Data="@ChartData">
    <DxPolarChartLineSeries ValueField="@((WeatherForecast i) => i.TemperatureC)"
                            ArgumentField="@(i => i.Date.Date)"
                            Name="Temperature, C" />
    <DxChartTitle Text="Weather Forecast, °C" />
    <DxChartLegend Visible="false" />
</DxPolarChart>

@code {
    IEnumerable<WeatherForecast> ChartData;

    protected override void OnInitialized() {
        ChartData = ForecastService.GetForecast();
    }
}
@inject WeatherForecastService ForecastService

<DxPieChart Data="@ChartData"
            LabelOverlap="PieChartLabelOverlap.Hide">
    <DxPieChartSeries ValueField="@((WeatherForecast i) => i.TemperatureC)"
                      ArgumentField="@(i => i.Date.Date)"
                      Name="Temperature, C">
        <DxChartSeriesLabel Visible="true" />
    </DxPieChartSeries>
    <DxChartTitle Text="Weather Forecast, °C" />
    <DxChartLegend Visible="false" />
</DxPieChart>

@code {
    IEnumerable<WeatherForecast> ChartData;

    protected override void OnInitialized() {
        ChartData = ForecastService.GetForecast();
    }
}
using System;

public class WeatherForecast {
    public DateOnly Date { get; set; }
    public int TemperatureC { get; set; }
    public int TemperatureF => 32 + (int)(TemperatureC / 0.5556);
    public string? Summary { get; set; }
}
public class WeatherForecastService {
    // ...
    private IEnumerable<WeatherForecast> Forecast { get; set; }

    public WeatherForecastService() {
        // ...
        Forecast = CreateForecast();
    }

    // ...
    private List<WeatherForecast> CreateForecast() {
        var rng = new Random();
        DateTime startDate = DateTime.Now;
        return Enumerable.Range(1, 15).Select(index => new WeatherForecast {
            Date = startDate.AddDays(index),
            TemperatureC = rng.Next(0, 10),
        }).ToList();
    }

    public IEnumerable<WeatherForecast> GetForecast() {
        return Forecast.ToArray();
    }
}
// ...
builder.Services.AddSingleton<WeatherForecastService>();
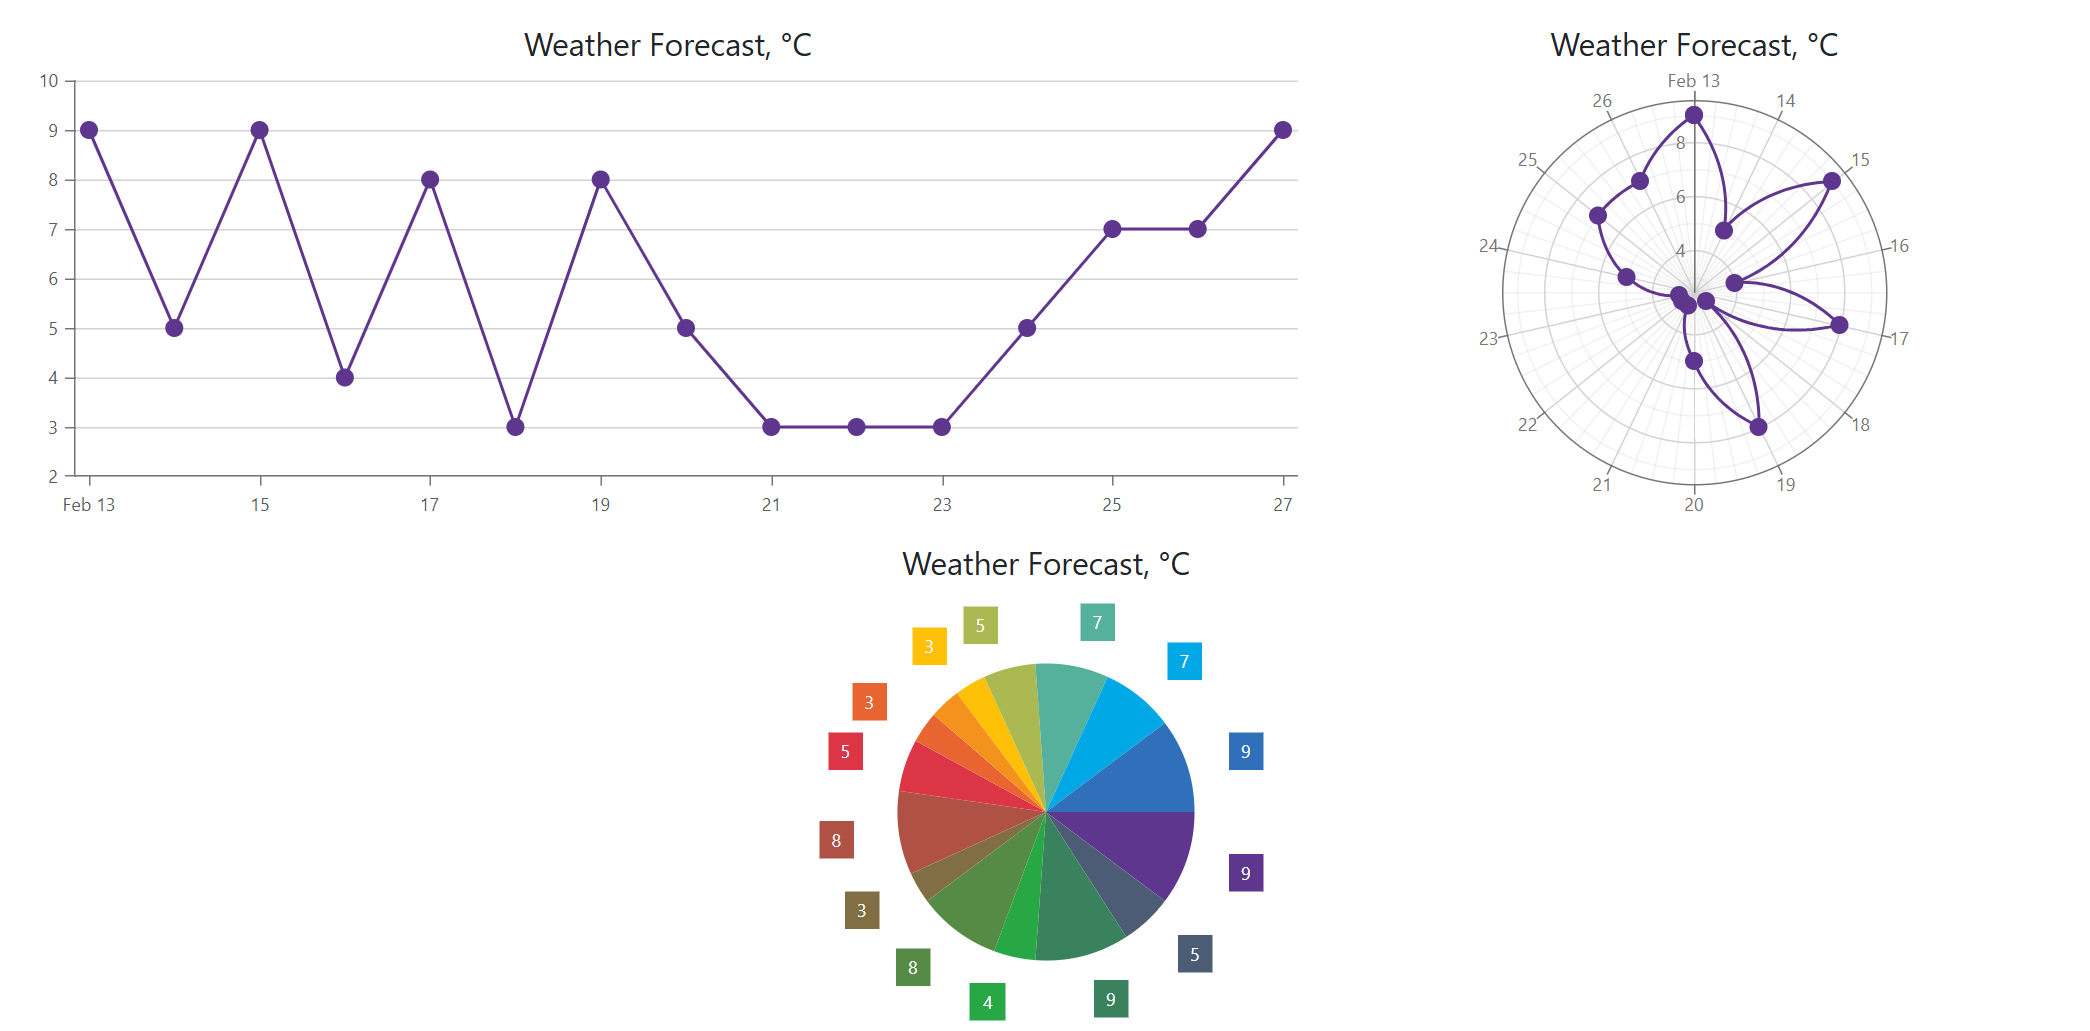
Asynchronous Data Binding
Blazor Charts can also use data collections that become available after asynchronous component initialization.
- Bind the
Data parameter to a C# field or property.
- Populate this field or property with data in the OnInitializedAsync lifecycle method (use the await operator).
@inject WeatherForecastService ForecastService

<DxChart Data="@ChartData">
    <DxChartLineSeries ValueField="@((WeatherForecast i) => i.TemperatureC)"
                       ArgumentField="@(i => i.Date.Date)"
                       Name="Temperature, C" />
    <DxChartTitle Text="Weather Forecast, °C" />
    <DxChartLegend Visible="false" />
</DxChart>

@code {
    WeatherForecast[] ChartData;

    protected override async Task OnInitializedAsync() {
        ChartData = await ForecastService.GetForecastAsync();
    }
}
@inject WeatherForecastService ForecastService

<DxPolarChart Data="@ChartData">
    <DxPolarChartLineSeries ValueField="@((WeatherForecast i) => i.TemperatureC)"
                            ArgumentField="@(i => i.Date.Date)"
                            Name="Temperature, C" />
    <DxChartTitle Text="Weather Forecast, °C" />
    <DxChartLegend Visible="false" />
</DxPolarChart>

@code {
    WeatherForecast[] ChartData;

    protected override async Task OnInitializedAsync() {
        ChartData = await ForecastService.GetForecastAsync();
    }
}
@inject WeatherForecastService ForecastService

<DxPieChart Data="@ChartData"
            LabelOverlap="PieChartLabelOverlap.Hide">
    <DxPieChartSeries ValueField="@((WeatherForecast i) => i.TemperatureC)"
                      ArgumentField="@(i => i.Date.Date)"
                      Name="Temperature, C">
        <DxChartSeriesLabel Visible="true" />
    </DxPieChartSeries>
    <DxChartTitle Text="Weather Forecast, °C" />
    <DxChartLegend Visible="false" />
</DxPieChart>

@code {
    WeatherForecast[] ChartData;

    protected override async Task OnInitializedAsync() {
        ChartData = await ForecastService.GetForecastAsync();
    }
}
using System;

public class WeatherForecast {
    public DateOnly Date { get; set; }
    public int TemperatureC { get; set; }
    public int TemperatureF => 32 + (int)(TemperatureC / 0.5556);
    public string? Summary { get; set; }
}
public class WeatherForecastService {
    // ...
    private IEnumerable<WeatherForecast> Forecast { get; set; }

    public WeatherForecastService() {
        // ...
        Forecast = CreateForecast();
    }

    // ...
    private List<WeatherForecast> CreateForecast() {
        var rng = new Random();
        DateTime startDate = DateTime.Now;
        return Enumerable.Range(1, 15).Select(index => new WeatherForecast {
            Date = startDate.AddDays(index),
            TemperatureC = rng.Next(0, 10),
        }).ToList();
    }

    public Task<WeatherForecast[]> GetForecastAsync(CancellationToken ct = default) {
        return Task.FromResult(Forecast.ToArray());
    }
}
// ...
builder.Services.AddSingleton<WeatherForecastService>();
Specific Collection Types
Observable Data Collections
You can bind Blazor Charts to data collections that implement the INotifyCollectionChanged or IBindingList interface. For instance, you can use standard ObservableCollection<T> or BindingList<T> objects. These collections notify the Chart component about changes, such as add, remove, or collection refresh operations. The Chart updates its data automatically to reflect these changes.
Each item in such collections should also implement the INotifyPropertyChanged interface to notify the Chart when a property value changes.
The following code snippet binds Blazor Charts to an ObservableCollection and adds new items to this collection on button clicks. The INotifyPropertyChanged interface is not implemented because collection item properties do not change.
@using System.Collections.ObjectModel

<DxButton Text="Add New Day"
          Click="(e) => AddNewForecast()" />

<DxChart Data="@WeatherForecastData">
    <DxChartLineSeries ValueField="@((WeatherForecast i) => i.TemperatureC)"
                       ArgumentField="@(i => i.Date.Date)"
                       Name="Temperature, C" />
    <DxChartTitle Text="Weather Forecast, °C" />
    <DxChartLegend Visible="false" />
</DxChart>

@code {
    int DayCount { get; set; } = 0;
    ObservableCollection<WeatherForecast> WeatherForecastData { get; set; }
    static readonly Random Rnd = new Random();

    protected override void OnInitialized() {
        WeatherForecastData = new ObservableCollection<WeatherForecast>();
        foreach (var date in Enumerable.Range(1, 5).Select(i => DateTime.Now.Date.AddDays(i))) {
            AddNewForecast();
        }
    }

    void AddNewForecast() {
        WeatherForecastData.Add(new WeatherForecast() {
                Date = DateTime.Now.Date.AddDays(++DayCount),
                TemperatureC = Rnd.Next(10, 20)
        });
    }
}
@using System.Collections.ObjectModel

<DxButton Text="Add New Day"
          Click="(e) => AddNewForecast()" />

<DxPolarChart Data="@WeatherForecastData">
    <DxPolarChartLineSeries ValueField="@((WeatherForecast i) => i.TemperatureC)"
                            ArgumentField="@(i => i.Date.Date)"
                            Name="Temperature, C" />
    <DxChartTitle Text="Weather Forecast, °C" />
    <DxChartLegend Visible="false" />
</DxPolarChart>

@code {
    int DayCount { get; set; } = 0;
    ObservableCollection<WeatherForecast> WeatherForecastData { get; set; }
    static readonly Random Rnd = new Random();

    protected override void OnInitialized() {
        WeatherForecastData = new ObservableCollection<WeatherForecast>();
        foreach (var date in Enumerable.Range(1, 5).Select(i => DateTime.Now.Date.AddDays(i))) {
            AddNewForecast();
        }
    }

    void AddNewForecast() {
        WeatherForecastData.Add(new WeatherForecast() {
                Date = DateTime.Now.Date.AddDays(++DayCount),
                TemperatureC = Rnd.Next(10, 20)
        });
    }
}
@using System.Collections.ObjectModel

<DxButton Text="Add New Day"
          Click="(e) => AddNewForecast()" />

<DxPieChart Data="@WeatherForecastData"
            LabelOverlap="PieChartLabelOverlap.Hide">
    <DxPieChartSeries ValueField="@((WeatherForecast i) => i.TemperatureC)"
                      ArgumentField="@(i => i.Date.Date)"
                      Name="Temperature, C">
        <DxChartSeriesLabel Visible="true" />
    </DxPieChartSeries>
    <DxChartTitle Text="Weather Forecast, °C" />
    <DxChartLegend Visible="false" />
</DxPieChart>

@code {
    int DayCount { get; set; } = 0;
    ObservableCollection<WeatherForecast> WeatherForecastData { get; set; }
    static readonly Random Rnd = new Random();

    protected override void OnInitialized() {
        WeatherForecastData = new ObservableCollection<WeatherForecast>();
        foreach (var date in Enumerable.Range(1, 5).Select(i => DateTime.Now.Date.AddDays(i))) {
            AddNewForecast();
        }
    }

    void AddNewForecast() {
        WeatherForecastData.Add(new WeatherForecast() {
                Date = DateTime.Now.Date.AddDays(++DayCount),
                TemperatureC = Rnd.Next(10, 20)
        });
    }
}
using System;

public class WeatherForecast {
    public DateOnly Date { get; set; }
    public int TemperatureC { get; set; }
    public int TemperatureF => 32 + (int)(TemperatureC / 0.5556);
    public string? Summary { get; set; }
}
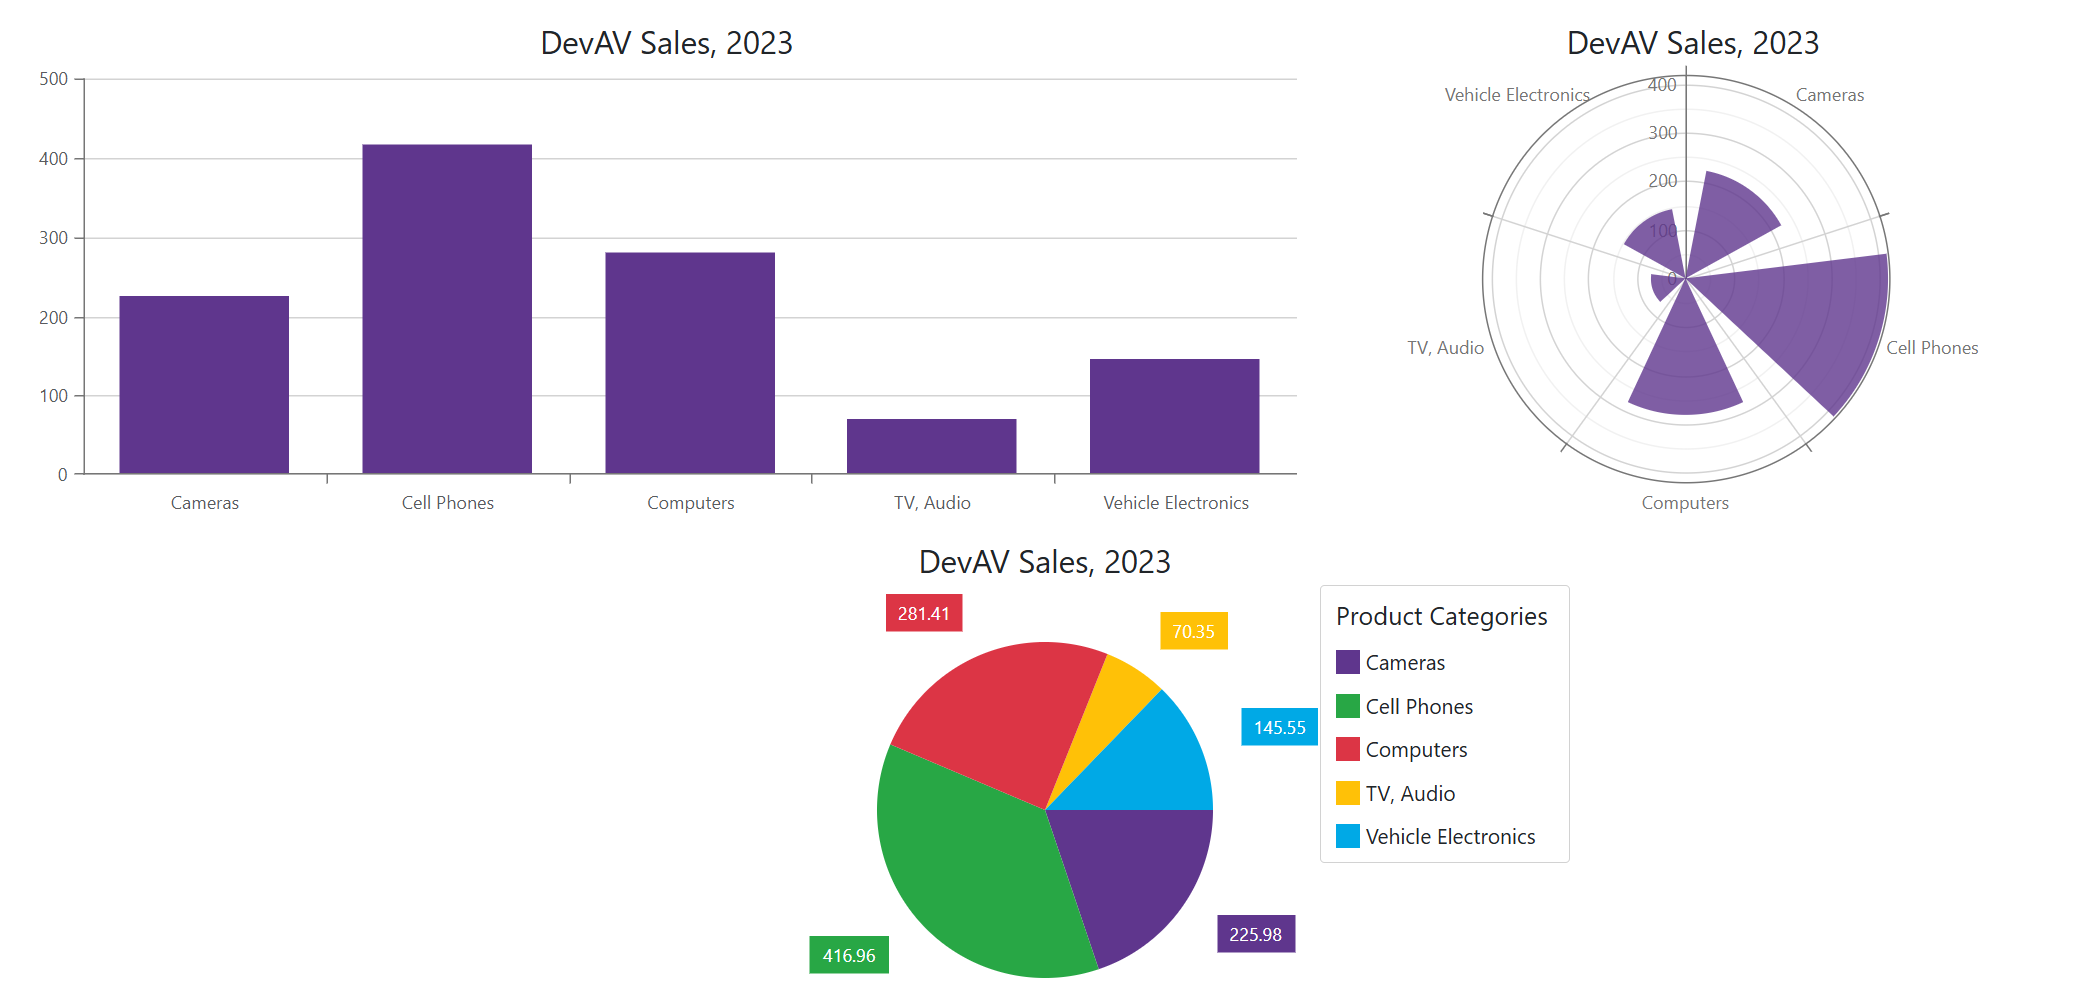
Binding to DataTable
You can bind Blazor Charts to DataTable objects:
- Create a DataTable object in code.
- Assign this object to the Chart’s
Data property and call the AsEnumerable(DataTable) method to make the data table enumerable.
- Declare series objects and specify their
ArgumentField and ValueField properties to retrieve data from the corresponding table columnns.
<DxChart T="object"
         Data="@dataTable.AsEnumerable()"
         Width="1200px">
    <DxChartBarSeries ArgumentField='(DataRow r) => r["Product"]'
                      ValueField='(DataRow r) => r["SalesAmount"]' />
    <DxChartTitle Text="DevAV Sales, 2023" />
    <DxChartLegend Visible="false" />
</DxChart>

@code {
    DataTable? dataTable;

    protected override void OnInitialized() {
        dataTable = GetDataTable();
    }
}
<DxPolarChart T="object"
              Data="@dataTable.AsEnumerable()"
              Width="700px">
    <DxPolarChartBarSeries ArgumentField='(DataRow r) => r["Product"]'
                           ValueField='(DataRow r) => r["SalesAmount"]' />
    <DxChartTitle Text="DevAV Sales, 2023" />
    <DxChartLegend Visible="false" />
</DxPolarChart>

@code {
    DataTable? dataTable;

    protected override void OnInitialized() {
        dataTable = GetDataTable();
    }
}
<DxPieChart T="object"
            Data="@dataTable.AsEnumerable()"
            Width="700px">
    <DxPieChartSeries ArgumentField='(DataRow r) => r["Product"]'
                      ValueField='(DataRow r) => r["SalesAmount"]'>
        <DxChartSeriesLabel Visible="true" />
    </DxPieChartSeries>
    <DxChartTitle Text="DevAV Sales, 2023" />
    <DxChartLegend Orientation="Orientation.Vertical"
                   HorizontalAlignment="HorizontalAlignment.Right">
        <DxChartTitle Text="Product Categories" />
    </DxChartLegend>
</DxPieChart>

@code {
    DataTable? dataTable;

    protected override void OnInitialized() {
        dataTable = GetDataTable();
    }
}
DataTable GetDataTable() {
    DataTable dataTable = new DataTable();
    dataTable.Columns.Add("Product", typeof(string));
    dataTable.Columns.Add("SalesAmount", typeof(double));
    dataTable.Rows.Add("Cameras", 225.98);
    dataTable.Rows.Add("Cell Phones", 416.96);
    dataTable.Rows.Add("Computers", 281.41);
    dataTable.Rows.Add("TV, Audio", 70.35);
    dataTable.Rows.Add("Vehicle Electronics", 145.55);
    return dataTable;
}