Blazor Pie and Donut Chart
- 2 minutes to read
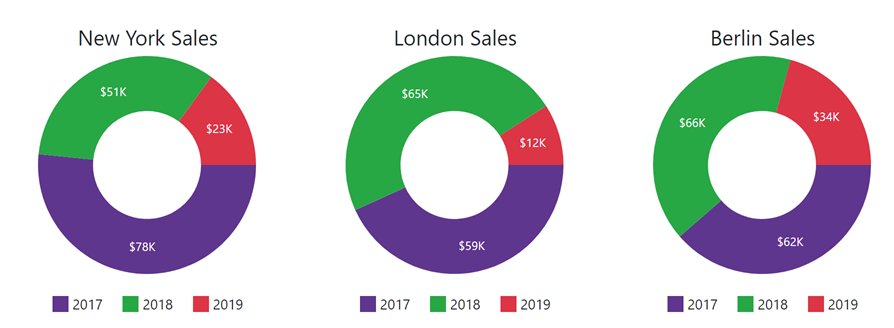
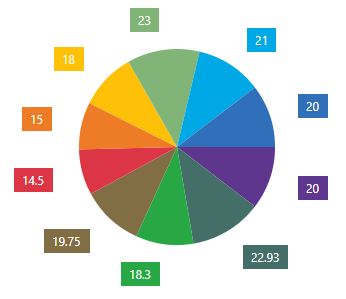
DevExpress Pie Chart for Blazor (<DxPieChart>) allows you to visualize data as a pie or donut chart.
API Reference
Refer to the following list for the component API reference: DxPieChart Members.
Supported Series Types
The DevExpress Blazor Pie Chart supports one series type – DxPieChartSeries. Specify the InnerDiameter property to create a donut chart.
Data Binding
The DevExpress Blazor Pie Chart supports various data binding scenarios:
For examples on how to bind to the most commonly used data collections, refer to the following sections:
Labels
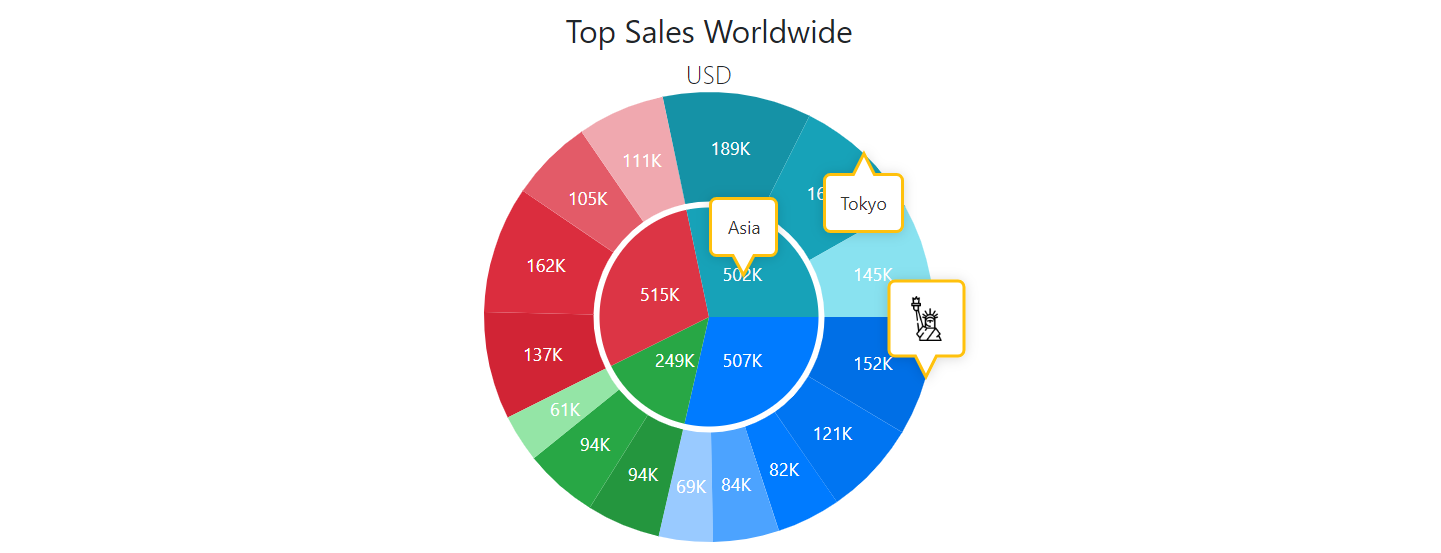
You can add labels to chart series. You can format values and customize label appearance.
Descriptive Elements
To help users understand visualized data, you can add descriptive elements to your charts – a legend, titles and subtitles, tooltips, and annotations.
Customization
DevExpress Charts for Blazor allow you to customize the appearance of nested/inner components and chart elements. You can also apply a custom color palette and change the component font.
User Interaction Options
DevExpress Blazor Charts allow users to interact with their content: users can select, click, and hover over series and points.
Export
You can export chart content as an encoded string in a specified format (PNG, PDF, JPEG, and GIF).