Series View Compatibility
- 5 minutes to read
This document describes certain limitations which should be taken into account in order to plot series of different view types together onto the same chart control.
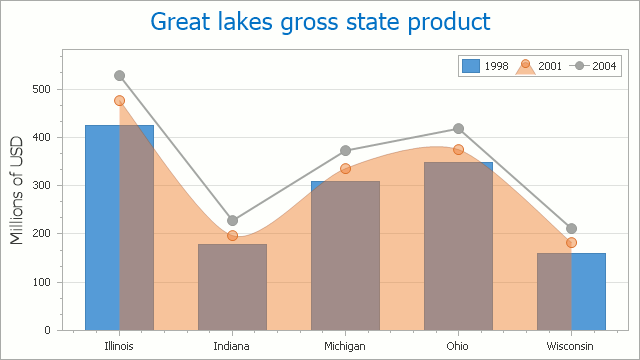
With the WinForms Chart Control it is possible to combine several series of different view types into a single chart, and show all of them simultaneously. For instance, you may combine bars and lines together, or even show the candle stick chart on the same diagram as shown in the images below.
However, the following constraint is imposed on the view types of series, in order to plot them together:
Note
Series of different view types can be plotted within the same diagram, if their view types support the same diagram type.
Furthermore, the type of a chart’s diagram is determined by the view type of the first visible series in the chart’s collection. And, the Diagram object is equal to null (Nothing in Visual Basic) until the chart has at least one series.
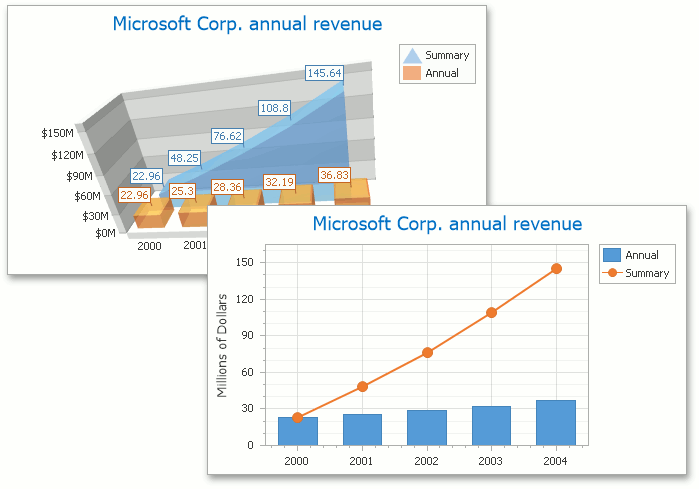
Therefore, it’s impossible to plot 2D and 3D series within the same chart, and for example, a Pie series together with a Bar series: their diagram types are different, so you can only plot two independent chart controls side-by-side.
The following image demonstrates two charts with different diagram types (XY-Diagram and XY-Diagram 3D). And, each chart contains series of different view types, adapted for this diagram type.
The following table lists the available diagram types, and series view types they support.
For more detailed information on each diagram type, refer to the corresponding document in the Diagram Types section of this help.
Example: How to Combine Several Charts on a Single 2D XY-Diagram
This example demonstrates how to display several series of different view types within a single diagram.
using DevExpress.XtraCharts;
// ...

namespace CombineSeveralCharts2D {
    public partial class Form1 : Form {
        public Form1() {
            InitializeComponent();
        }

        private void Form1_Load(object sender, EventArgs e) {
            // Create an empty chart.
            ChartControl combinedChart = new ChartControl();

            // Create two series of different types.
            Series series1 = new Series("Area Series", ViewType.StepLine);
            Series series2 = new Series("Line Series", ViewType.Spline);

            // Add points to them.
            series1.Points.Add(new SeriesPoint(1, new double[] { 10 }));
            series1.Points.Add(new SeriesPoint(2, new double[] { 2 }));
            series1.Points.Add(new SeriesPoint(3, new double[] { 14 }));
            series1.Points.Add(new SeriesPoint(4, new double[] { 17 }));

            series2.Points.Add(new SeriesPoint(1, new double[] { 5 }));
            series2.Points.Add(new SeriesPoint(2, new double[] { 16 }));
            series2.Points.Add(new SeriesPoint(3, new double[] { 4 }));
            series2.Points.Add(new SeriesPoint(4, new double[] { 11 }));

            // Add series to the chart.
            combinedChart.Series.Add(series2);
            combinedChart.Series.Add(series1);

            // Hide the legend (if necessary).
            combinedChart.Legend.Visibility = DevExpress.Utils.DefaultBoolean.False;

            // Add the chart to the form.
            combinedChart.Dock = DockStyle.Fill;
            this.Controls.Add(combinedChart);

        }
    }
}