Doughnut Chart
- 3 minutes to read
Short Description
The Doughnut Chart is represented by the Doughnut3DSeriesView object, which belongs to Pie and Donut Series Views. This view is useful when it’s necessary to compare the percentage values of different point arguments in the same series, and to illustrate these values as easy to understand pie slices, but with a hole in its center. In addition, the 3D look makes it possible to rotate a chart to position pie slices in an attractive and easy-to-understand way.
A Doughnut chart is shown in the image below.
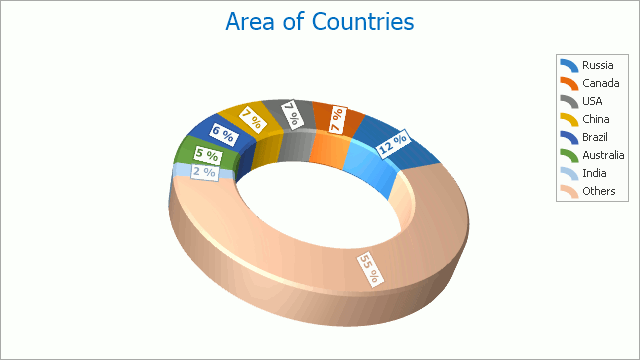
Chart Type Characteristics
The table below lists the main characteristics of this chart type.
| Feature | Value |
|---|---|
| Series View type | Doughnut3DSeriesView |
| Diagram type | SimpleDiagram3D |
| Number of arguments per series point | 1 |
| Number of values per series point | 1 |
Note
For information on which chart types can be combined with the Doughnut Chart, refer to the Series Views Compatibility document.
Example
The following example demonstrates how to create a ChartControl with a series of the Doughnut3DSeriesView type, set its general properties, and add this chart to a form at runtime. Before proceeding with this example, first create a Windows Forms Application in Visual Studio, and include all necessary assemblies to the References list of your project.
Then, add the following code to the Form.Load event handler.
using System;
using System.Windows.Forms;
using DevExpress.XtraCharts;
// ...

private void Form1_Load(object sender, EventArgs e) {
    // Create an empty chart.
    ChartControl DoughnutChart3D = new ChartControl();

    // Create a doughnut series.
    Series series1 = new Series("Doughnut Series 1", ViewType.Doughnut3D);

    // Populate the series with points.
    series1.Points.Add(new SeriesPoint("Russia", 17.0752));
    series1.Points.Add(new SeriesPoint("Canada", 9.98467));
    series1.Points.Add(new SeriesPoint("USA", 9.63142));
    series1.Points.Add(new SeriesPoint("China", 9.59696));
    series1.Points.Add(new SeriesPoint("Brazil", 8.511965));
    series1.Points.Add(new SeriesPoint("Australia", 7.68685));
    series1.Points.Add(new SeriesPoint("India", 3.28759));
    series1.Points.Add(new SeriesPoint("Others", 81.2));

    // Add the series to the chart.
    DoughnutChart3D.Series.Add(series1);

    // Adjust the value numeric options of the series.
    series1.PointOptions.ValueNumericOptions.Format = NumericFormat.Percent;
    series1.PointOptions.ValueNumericOptions.Precision = 2;

    // Adjust the view-type-specific options of the series.
    ((Doughnut3DSeriesView)series1.View).HoleRadiusPercent = 30;
    ((Doughnut3DSeriesView)series1.View).ExplodedPoints.Add(series1.Points[0]);

    // Access the diagram's options.
    ((SimpleDiagram3D)DoughnutChart3D.Diagram).RotationType = RotationType.UseAngles;
    ((SimpleDiagram3D)DoughnutChart3D.Diagram).RotationAngleX = -35;

    // Add a title to the chart and hide the legend.
    ChartTitle chartTitle1 = new ChartTitle();
    chartTitle1.Text = "3D Doughnut Chart";
    DoughnutChart3D.Titles.Add(chartTitle1);
    DoughnutChart3D.Legend.Visible = false;

    // Add the chart to the form.
    DoughnutChart3D.Dock = DockStyle.Fill;
    this.Controls.Add(DoughnutChart3D);
}