Chart Titles
- 4 minutes to read
This document describes how chart titles can be created and customized, and illustrates their general functionality.
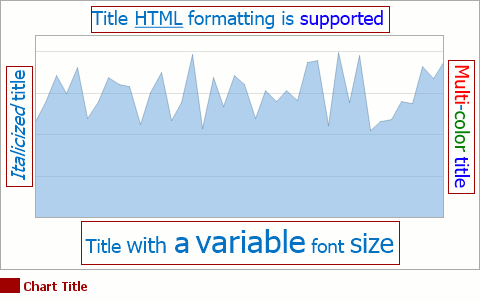
Chart titles allow you to accompany your chart with text headers and explanations with HTML support, and no limitations on the size and quantity of titles.
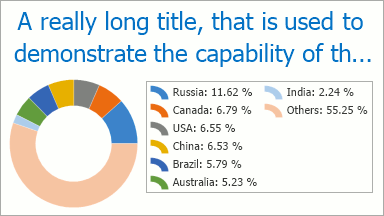
Note that if a chart title’s length exceeds the size of the chart, you can force the title’s text to be wrapped in multiple lines using the AlignedTitle.WordWrap property.
To access the chart title collection at design time, select the chart control, and in the Properties window, locate the ChartControl.Titles property. Click its ellipsis button, and the Chart Title Collection Editor will appear.
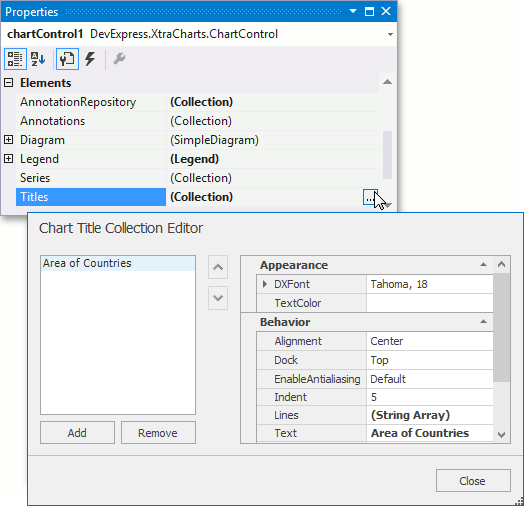
In this dialog, use the Add button to create chart titles. After a title is created, you can customize its appearance and behavior using the available properties briefly described below.
- A title’s text is determined by the Title.Text property. You can apply HTML formatting to your chart’s titles, by using standard HTML tags. To learn more on HTML support, refer to HTML Text Formatting.
- The appearance of title text can be customized with the TitleBase.DXFont, TitleBase.EnableAntialiasing and TitleBase.TextColor properties. Note that the color defined with title HTML tags <color></color> has priority over the title’s TitleBase.TextColor property’s setting.
- Placement of titles within a chart is determined by their AlignedTitle.DXAlignment and DockableTitle.Dock properties.
- To define the spacing around a title (in pixels), define its DockableTitle.Indent property.
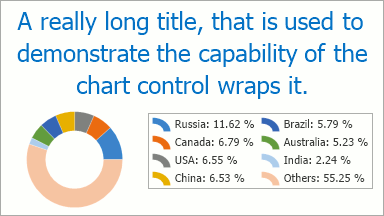
To enable automatic word wrapping for lengthy chart titles, use the AlignedTitle.WordWrap property.
After you enable this property, the AlignedTitle.MaxLineCount property comes into effect, which allows you to determine the limit for new lines appearing when a title’s text is wrapped. Note that if a title’s length exceeds this limit, the last line of text will be cut off by an ellipsis.
If required, you can set the AlignedTitle.MaxLineCount property to 0, which will wrap title completely.
- To hide a title while maintaining it in the collection, disable its TitleBase.Visible property.
Note
The Chart Control can hide its elements if there is insufficient space to display them. Elements are hidden in the following order:
- Legends
- Axis Titles
- Series Titles
- Pane Titles
- Axes
- Chart Title
- Breadcrumbs
To make the Chart Control always display its elements, disable the ChartControl.AutoLayout property.
Example: How to Create and Customize Chart Titles
This example demonstrates how to create and customize chart titles at runtime.
using System;
using System.Drawing;
using System.Windows.Forms;
using DevExpress.Drawing;
using DevExpress.XtraCharts;
namespace WindowsApplication25 {
public partial class Form1 : Form {
public Form1() {
InitializeComponent();
}
private void Form1_Load(object sender, EventArgs e) {
// Create chart titles.
ChartTitle chartTitle1 = new ChartTitle();
ChartTitle chartTitle2 = new ChartTitle();
// Define the text for the titles.
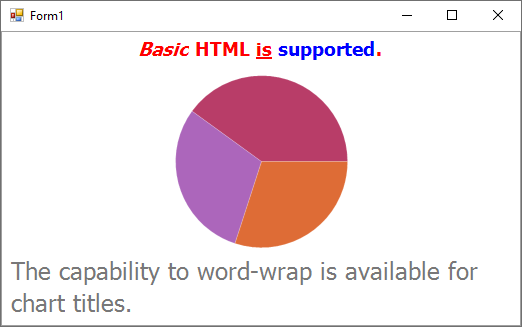
chartTitle1.Text = "<i>Basic</i> <b>HTML</b> <u>is</u> <color=blue>supported</color>.";
chartTitle2.Text = "The capability to word-wrap is available for chart titles.";
chartTitle2.WordWrap = true;
chartTitle2.MaxLineCount = 2;
// Define the alignment of the titles.
chartTitle1.Alignment = StringAlignment.Center;
chartTitle2.Alignment = StringAlignment.Near;
// Place the titles where it's required.
chartTitle1.Dock = ChartTitleDockStyle.Top;
chartTitle2.Dock = ChartTitleDockStyle.Bottom;
// Customize a title's appearance.
chartTitle1.EnableAntialiasing = DevExpress.Utils.DefaultBoolean.True;
chartTitle1.DXFont = new DXFont("Tahoma", 14, DXFontStyle.Bold);
chartTitle1.TextColor = Color.Red;
chartTitle1.Indent = 10;
// Add the titles to the chart.
chartControl1.Titles.AddRange(new ChartTitle[] {
chartTitle1,
chartTitle2});
}
}
}