Overlapped Range Bar Chart
- 4 minutes to read
Short Description
The Overlapped Range Bar Chart is represented by the OverlappedRangeBarSeriesView object, which belongs to Bar Series Views. This view displays either vertical or horizontal bars along the Y-axis (the axis of values). Each bar represents a range of data with two values for each argument value. This chart type is useful, for instance, when it’s necessary to show activity bars from different series one above another to precisely compare their duration.
An Overlapped Range Bar chart is shown in the image below. Note that this chart type is based upon the XYDiagram, and so it can be rotated to show bars either vertically or horizontally.
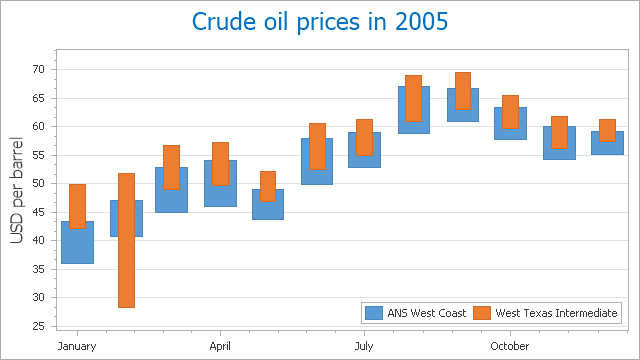
Chart Type Characteristics
The table below lists the main characteristics of this chart type.
| Feature | Value |
|---|---|
| Series View type | OverlappedRangeBarSeriesView |
| Diagram type | 2D-XYDiagram |
| Number of arguments per series point | 1 |
| Number of values per series point | 2 |
Note
For information on which chart types can be combined with the Overlapped Range Bar Chart, refer to the Series Views Compatibility document.
Example
The following example demonstrates how to create a ChartControl with two series of the OverlappedRangeBarSeriesView type, and add this chart to a form at runtime. Before proceeding with this example, first create a Windows Forms Application in Visual Studio, and include all necessary assemblies to the References list of your project.
Then, add the following code to the Form.Load event handler.
using System;
using System.Windows.Forms;
using DevExpress.XtraCharts;
// ...

private void Form1_Load(object sender, EventArgs e) {
    // Create a new chart.
    ChartControl rangeBarChart = new ChartControl();

    // Create two range bar series.
    Series series1 = new Series("Series 1", ViewType.RangeBar);
    Series series2 = new Series("Series 2", ViewType.RangeBar);

    // Add points to them.
    series1.Points.Add(new SeriesPoint("A", 9, 15));
    series1.Points.Add(new SeriesPoint("B", 4, 10));
    series1.Points.Add(new SeriesPoint("C", 3, 13));
    series1.Points.Add(new SeriesPoint("D", 2, 11));
    series1.Points.Add(new SeriesPoint("E", 1, 10));

    series2.Points.Add(new SeriesPoint("A", 10, 13));
    series2.Points.Add(new SeriesPoint("B", 5, 7));
    series2.Points.Add(new SeriesPoint("C", 6, 9));
    series2.Points.Add(new SeriesPoint("D", 3, 7));
    series2.Points.Add(new SeriesPoint("E", 2, 8));

    // Add both series to the chart.
    rangeBarChart.Series.AddRange(new Series[] { series1, series2 });

    // Access the view-type-specific options of the series.
    RangeBarSeriesView myView1 = (RangeBarSeriesView)series1.View;
    myView1.MaxValueMarker.Visible = true;
    myView1.MinValueMarker.Visible = true;
    myView1.MinValueMarker.Kind = MarkerKind.Circle;
    myView1.MinValueMarker.Kind = MarkerKind.Circle;
    myView1.MaxValueMarker.Kind = MarkerKind.Star;
    myView1.MaxValueMarker.StarPointCount = 5;
    ((RangeBarSeriesView)series2.View).BarWidth = 0.4;

    // Access the type-specific options of the diagram.
    ((XYDiagram)rangeBarChart.Diagram).EnableAxisXZooming = true;

    // Hide the legend (if necessary).
    rangeBarChart.Legend.Visible = false;

    // Add a title to the chart (if necessary).
    rangeBarChart.Titles.Add(new ChartTitle());
    rangeBarChart.Titles[0].Text = "An Overlapped Range Bar Chart";
    rangeBarChart.Titles[0].WordWrap = true;

    // Add the chart to the form.
    rangeBarChart.Dock = DockStyle.Fill;
    this.Controls.Add(rangeBarChart);
}